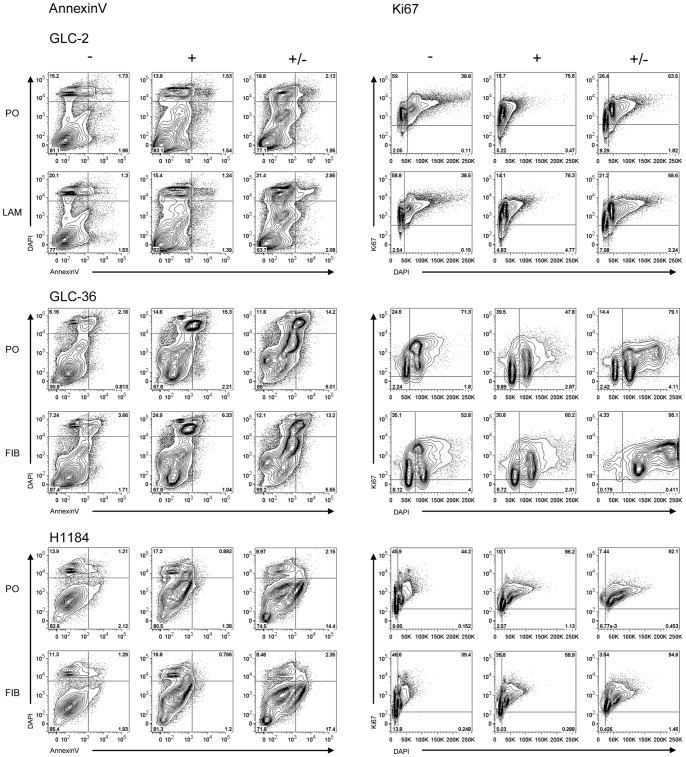
Figure 11. Cell cycle analysis of GLC-2, GLC-36 and H1184 cells.
Cells cultured on FIB, LAM or PO were kept untreated (−) or treated with 50 nM SSP for 24 h and analyzed by FACS immediately (+) or cultured for further 24 h in the absence of the drug (+/−). Panels on the left show representative FACS plots of cell viability of the analyzed cell lines (Annexin V). Panels on the right show representative FACS plots of cell cycle progression of the analyzed cell lines (Ki67).

