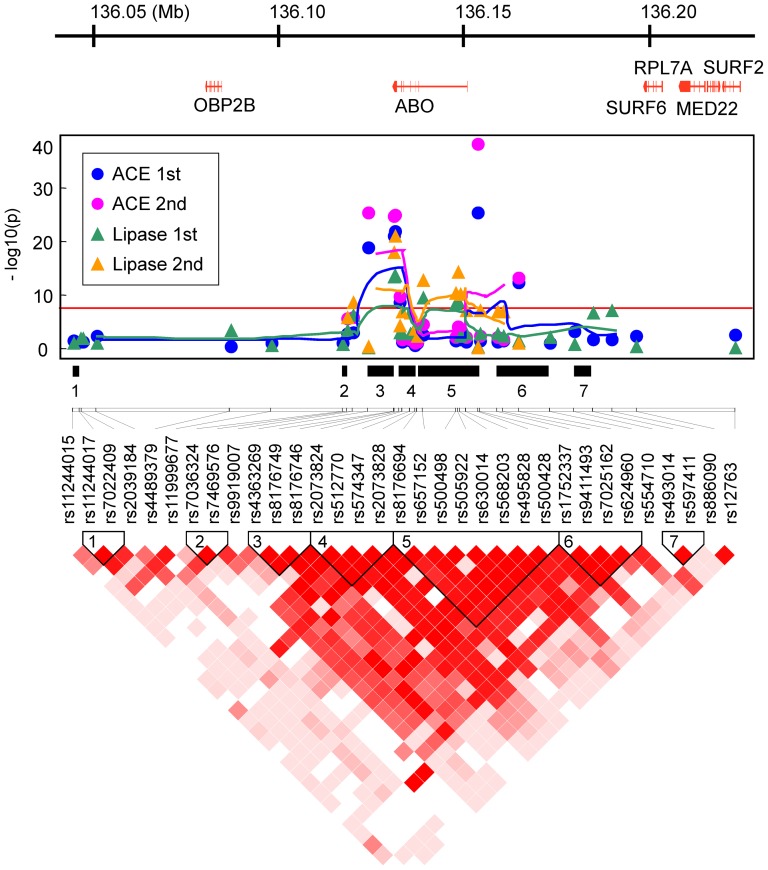
Figure 2. Gene map from RefSeq (upper panel), association pattern (middle), and LD structure (lower) by D′ measure in the Takahata population, in the 186 kb region from 136,040,829 to 136,227,260 of 9q32, using the coordinate system of the human genomic DNA sequence (GRCh37/hg19).
The association pattern is expressed by plots of −log(p-value) with lines connecting five-point moving averages for SNPs around the ABO and ACE1 loci in the Takahata (1st) and Yamagata (2nd) populations. The numbered black bars indicate LD blocks defined by a confidence-interval of D′ measure that reflects those in the LD structure panel.

