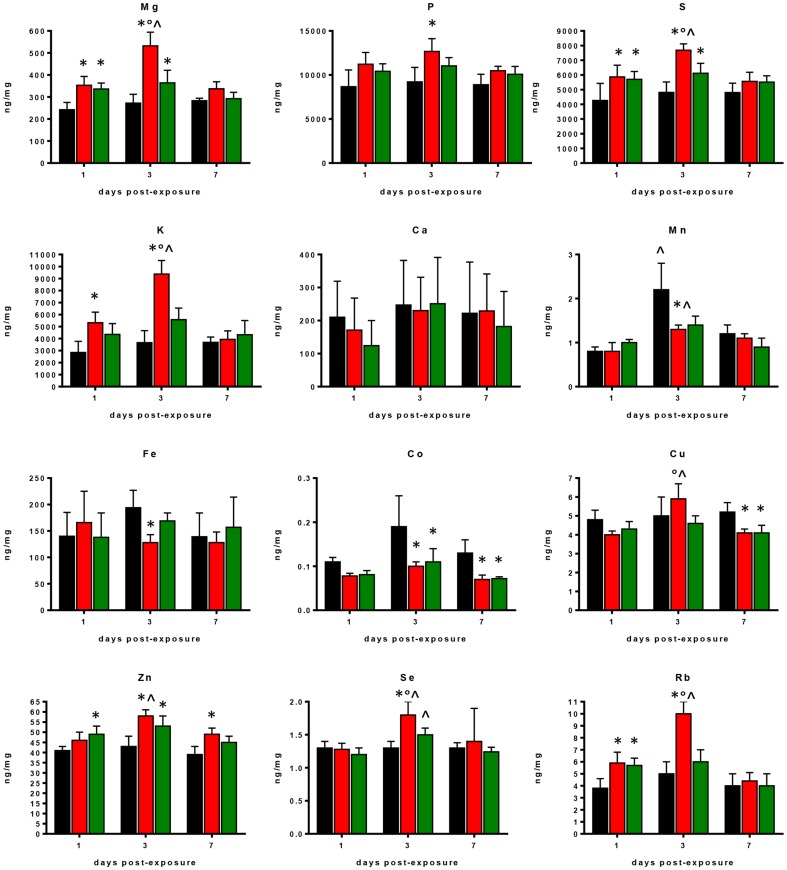
Figure 3. Changes in element profiles observed in lung tissues of control and S. maltophilia-infected DBA/2N mice.
Amount of each element was assessed - on days 1, 3, and 7 p.e. to S. maltophilia (Sm111 CF strain, red bars; C39 environmental strain, green bars)or PBS only (controls, black bars) - by ICP-MS analysis in lung homogenates from DBA/2 mice (n = 10 each group). Results are expressed as ng of element for mg of lung tissue (dry weight), and graphed as means + SDs. * p<0.05, vs control mice; ° p<0.05, vs C39 strain; ∧ p<0.05, between days p.e.; two-way ANOVA followed by Tukey's post-hoc test.

