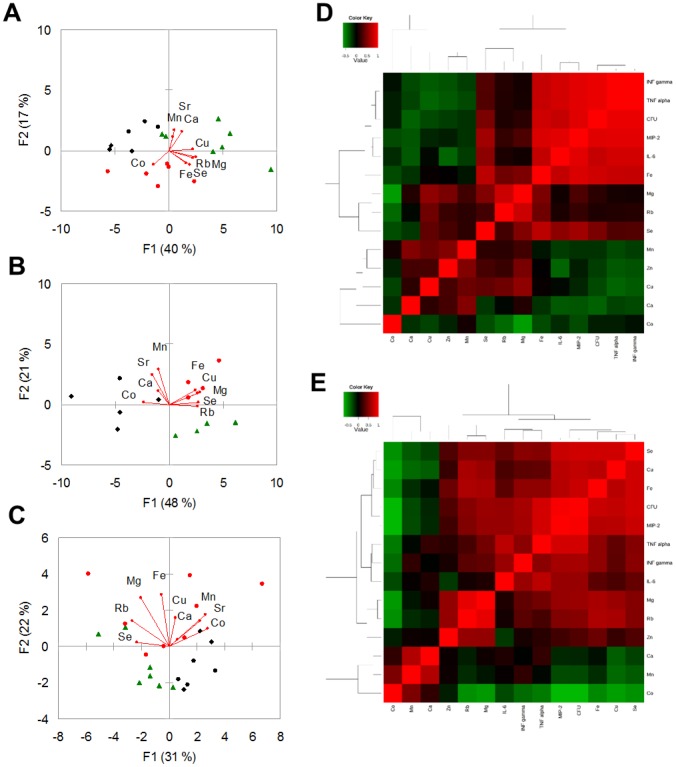
Figure 6. Trace elements, bacterial load, and cytokine levels observed in BAL samples of S. maltophilia-infected DBA/2N mice.
A–C) Score and loading plots obtained by Principal Component Analysis. These plots show PC1 vs PC2 summarizing 57%, 69%, and 53% of the variation among BAL samples collected on days 1 (A), 3 (B), and 7 (C) p.e. to S. maltophilia (Sm111 CF strain, red circles; C39 environmental strain, green triangles) or PBS only (controls, black rhombi). The amounts of variance explained by each PC are shown in parentheses. D–E) Correlation maps. The heatmaps show the unsupervised hierarchical clustering of BAL elements, bacterial counts in lung homogenate (CFU), and pulmonary cytokines assessed using Spearman's correlation in response to S. maltophilia infection by Sm111 CF (D) or C39 (E) strain. Direct and inverse correlations are shown in red and green, respectively. Correlation and cluster analysis were performed using MetaboAnalyst statistical analysis module [29].

