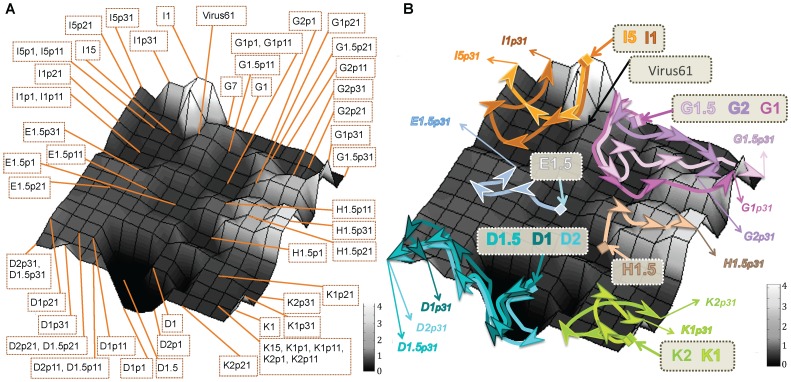
Figure 3. Representation of the fitness landscape of the HIV-1 studied viruses from the complete genome sequences and depiction of the viral recovery pathways.
The landscape was constructed by SOM with the complete genomic sequences from the set of 55 viruses (see Figure 1) and labelled with the fitness value of the closest sequence (factor L = 1 was used to label the network). The SOM was formed by a grid of 15×15 neurons (Fig. S1). Each vertex of the bi-dimensional mesh symbolized a neuron of the SOM network. Grey scale of the landscape represents the fitness values, from the lowest values in black to the highest in white. A) Fitness landscape showing the neuron that maps each viral sequence. B) Fitness landscape map displaying the pathways followed by the different viruses during the recovery passages, where the viruses from the same lineage are linked with the same colour arrow.

