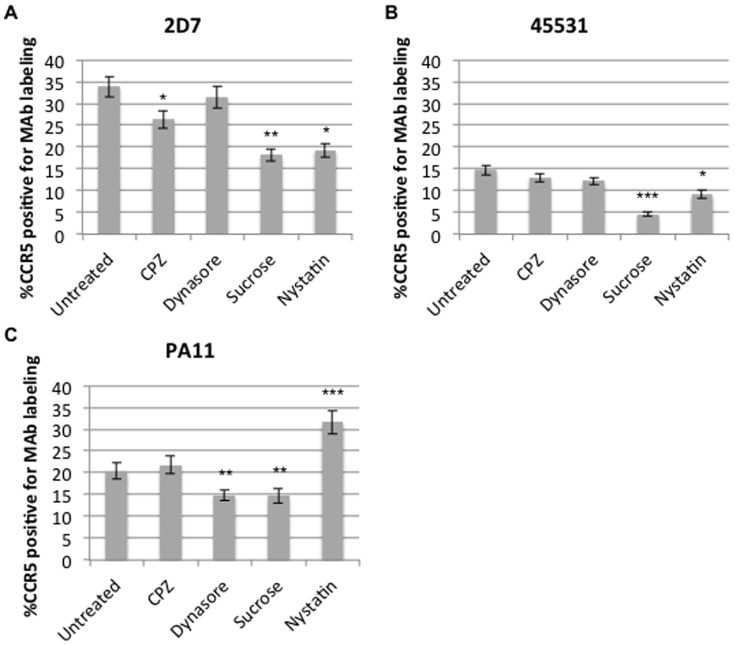
Figure 4. Surface expression of CCR5 conformations upon blocking endocytosis.
U87.CD4.CCR5-GFP cells were treated with 0.45 M sucrose, 5µM Dynasore, 5µg/mL chlorpromazine, or 50µg/mL nystatin, inhibitors of both clathrin- and caveolae-mediated endocytosis. Cells were then surface stained with (A) 2D7, (B) 45531 or (C) PA11. Graphs display averages of 3 experiments (N = 30 per experimental condition). Statistical analysis was performed using analysis of variance (ANOVA). ***p<.001, **p<.01, *p<.05, where significantly different than ‘Untreated.’

