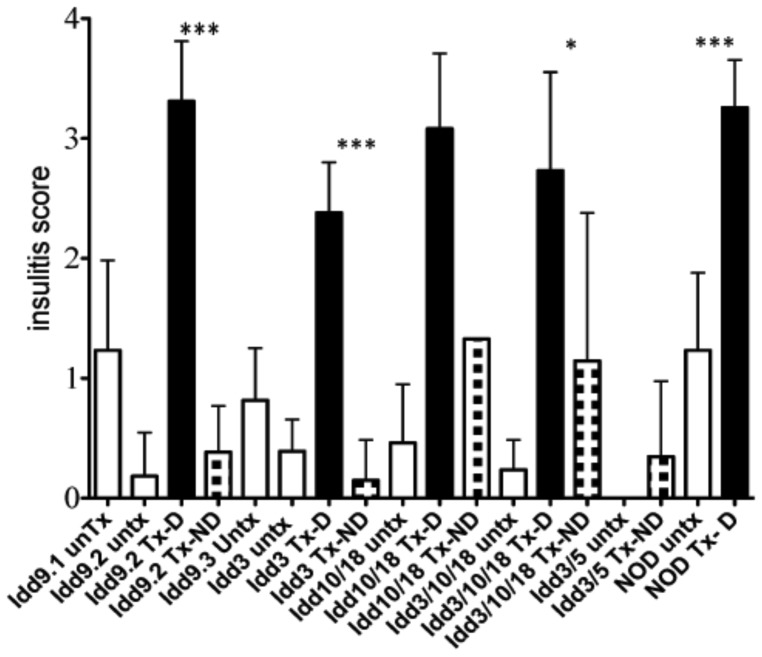
Figure 2. Insulitis scores in anti PDL1 treated mice.
Idd congenic mice were grouped into control treated (untx, white columns, Idd9.1 n = 7, Idd9.2 n = 10, Idd9.3 n = 9, Idd3 n = 4, Idd10/18 n = 5, Idd3/10/18 n = 18, Idd3/5 n = 3, NOD n = 7), anti PDL1 treated diabetic (Tx-D, checked columns, Idd9.2 n = 4, Idd3 n = 5, Idd10/18 n = 8, Idd3/10/18 n = 6, NOD n = 11) and anti PDL1 treated non-diabetic (Tx-ND, black columns, Idd9.2 n = 5, Idd3 n = 5, Idd10/18 n = 1#, Idd3/10/18 n = 6, Idd3/5 n = 17) mice. The antibody treatment was given to 10-week old mice at day 0 (500 µg), and days 2, 4, 6, 8 and 10 (250 µg). The injections were stopped once the mouse had become diabetic and had a glucose reading of >250 mg/dl on two consecutive days. H&E sections of pancreases were scored for degree of infiltrating lymphocytes in islets. Results are expressed as Mean±SD. P-values are expressed as * (P<0.05), ** (P<0.01), *** (P<0.0001). # In case of the Idd10/18 mice, treatment with anti PDL1 resulted in 94% of diabetes incidence. Therefore, it was extremely difficult to increase the n of anti PDL1 treated non-diabetic group.

