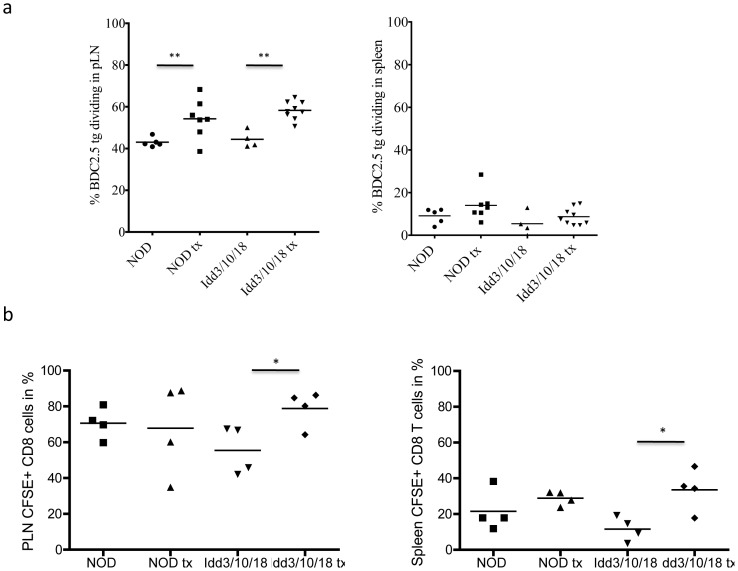
Figure 5. Proliferation of adoptively transferred BDC2.5 Tg CD4 T and NY8.3 tg CD8+ T cells in pancreatic LN and spleen of anti PDL1 treated NOD and Idd3/10/18 mice.
a) Collective data from 3 out of 8 experiments of the percentage of CFSE-dividing cells (gated on CD4+ Vβ4+) are shown. Horizontal lines express mean value. For CD4+ T cells pLN, NOD, control vs. treated p = 0.0276; pLN, Idd3/10/18, control vs. treated p = 0.0002. b) A representative experiment from 3 performed is shown. For CD8 T cells pLN, Idd3/10/18 control vs. treated p = 0.0321, spleen Idd3/10/18 control vs. treated p = 0.0185.

