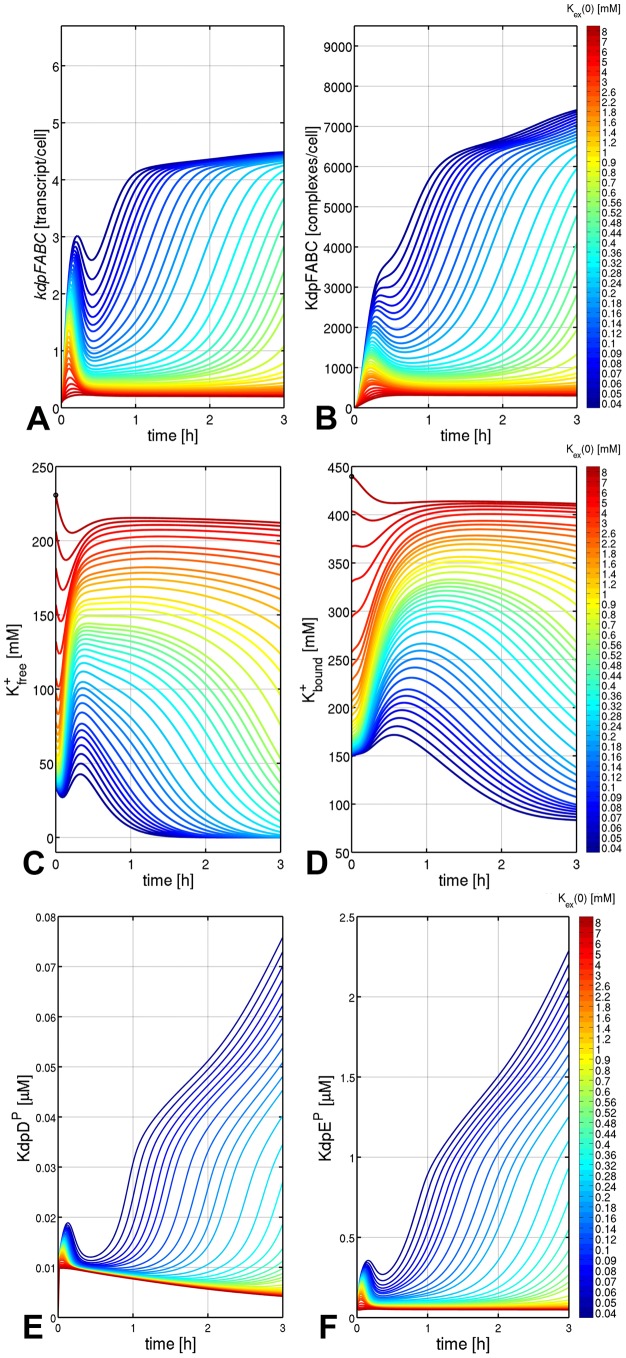
Figure 3. Predicted time-courses of intracellular variables of the Kdp system derived from simulations based on the model for different levels of K+ availability.
K+ availability is determined by the initial concentration of external K+ at t = 0 h, K+ex(0). kdpFABC transcripts and KdpFABC complexes decrease with increasing K+ex levels (A, B). Intracellular K+ (free and bound) increases with increasing external K+ (C, D). Time-courses of phosphorylated KdpD and KdpE are qualitatively very similar to the kdpFABC curves (E, F).

