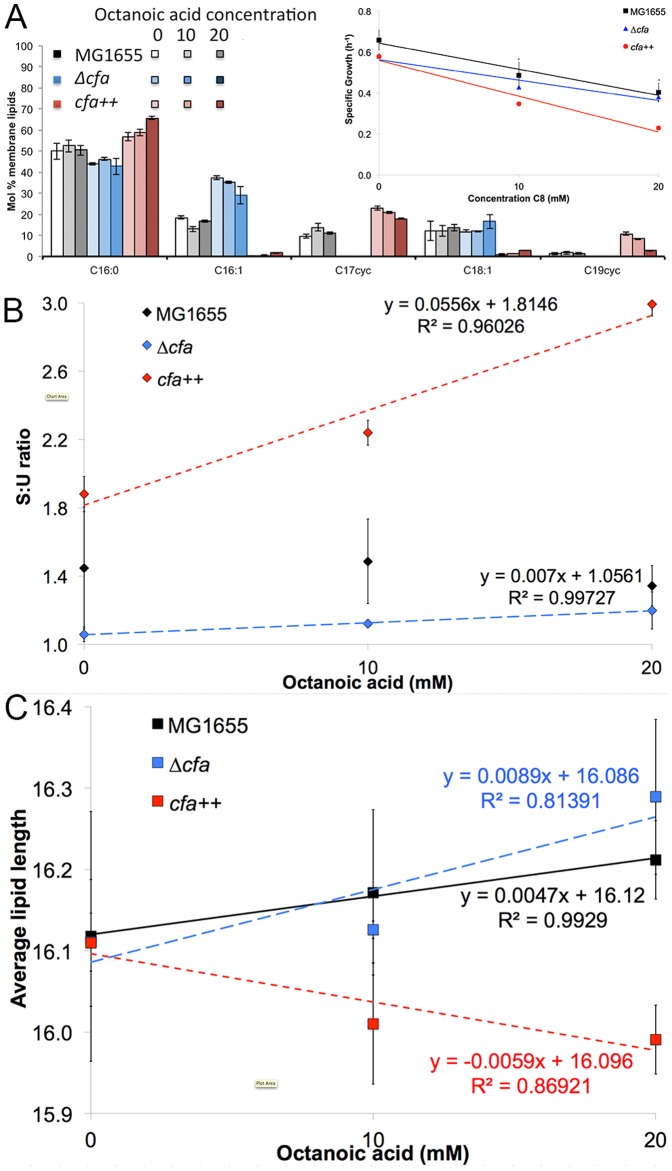
Figure 6. cfa mutants with altered the membrane lipid profile, S:U ratio and the average lipid length.
a: Membrane lipid profile of MG1655 and strains with altered cfa expression. Strains were incubated with 0–30 mM C8, pH = 7.0. Inset: specific growth rate in the log phase of E. coli with varying cfa expression. C16:0- palmitic acid, C16:1- palmitoleic acid, C17cyc- cyclopropane C17:0, C18:1- vaccenic acid, C18:0- stearic acid, C19cyc- cyclopropane C19:0. The complete lipid profiles are shown in Figure S2 of the Supporting Information. Membrane properties are calculated from a to obtain: b: saturated:unsaturated lipid ratio and c: average lipid length.

