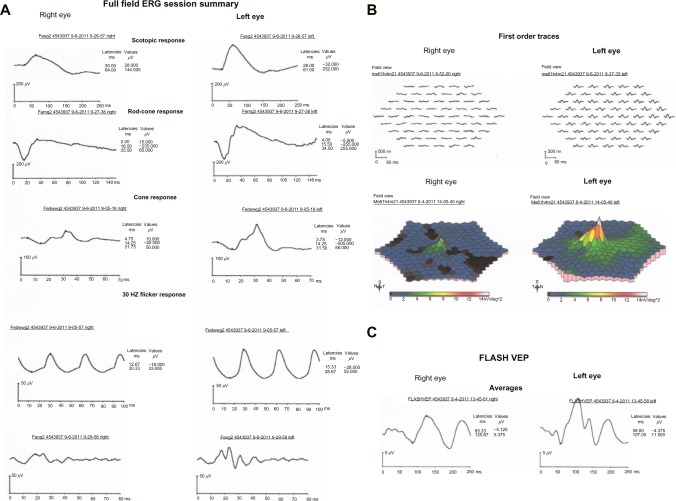
Figure 2.
(A) Full field electroretinogram (ERG) showing reduction of oscillatory potentials (OP) wave and b-wave amplitude in rod-specific, cone-specific, and maximal electroretinogram in the right eye. (B) Diminished waveform of multifocal electroretinogram in central area of the right eye. (C) Flash visual evoked potential (VEP) showing both amplitude reduction and delayed implicit time in the right eye.

