Figure 7.

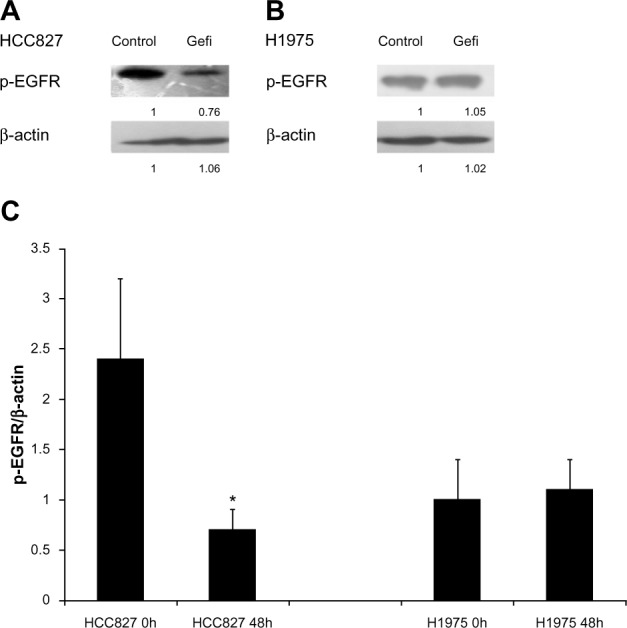
(A–C) Protein expression of phosphorylated epidermal growth-factor receptor (p-EGFR) in hepatocellular carcinoma (HCC)827 and H1975 cells determined by immunoblot analysis. The samples were collected at 0 and 48 hours after exposure to gefitinib (Gefi; 5 μM). (A and B) Immunoblots represent the observations from one single experiment repeated three times. The integrated optical densities of (C) p-EGFR proteins were analyzed after normalization with β-actin (43 kDa) in each lane; means ± standard error of the mean of three separate experiments.
Note: *Statistical difference when compared to the control group (P<0.05).
Abbreviation: h, hours.
