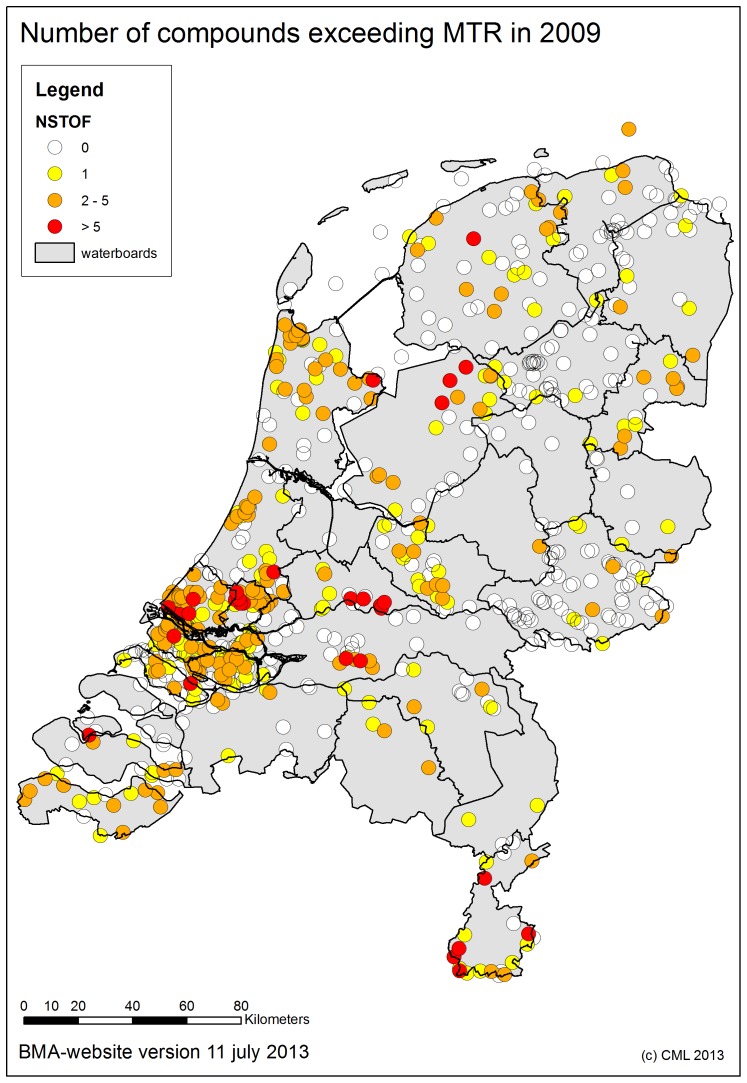
Figure 2. Number of pesticides exceeding the MPC in 2009.
All monitoring locations in the Dutch surface waters with one (yellow); two till five pesticides concentrations (orange); and > five different pesticides (red) exceeding their MPC-values are depicted. Locations were measurements were performed but no exceedances were found are depicted in white.

