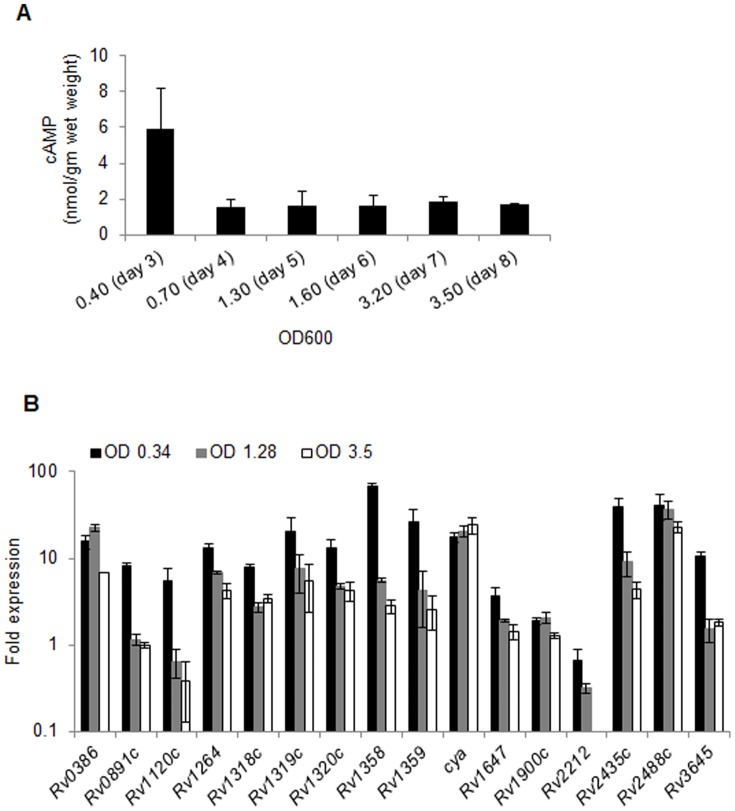
Figure 1. Kinetics of intracellular cAMP levels and expression of ACs in Mtb during in vitro growth.
A) Estimation of intracellular cAMP levels in Mtb. Wild-type Mtb CDC1551 was cultured in Middlebrook 7H9 broth supplemented with OADC, glycerol, and tween-80 at 37°C with shaking and growth was monitored at regular intervals by measuring optical density of the cultures at 600 nm (OD600). An aliquot of culture suspension was used at each time point up to 8 days for cAMP measurement, as described in materials and methods, and final cAMP concentration was calculated as nmol/gm wet weight. Data are the averages of two independent experiments and the mean values ± standard deviations are shown. B) Analysis of the expression of AC-encoding genes at different time points during in vitro growth of Mtb. Total RNA was isolated from Mtb CDC1551 cultures at regular intervals as shown in the graph. Quantitative RT-PCR (qRT-PCR) was performed, and the relative expression of each gene was calculated using values of sigA transcript for normalizing the RNA amounts and day-1 expression value as a control. The graph represents an average of two independent experiments and the mean values ± standard deviations are shown.

