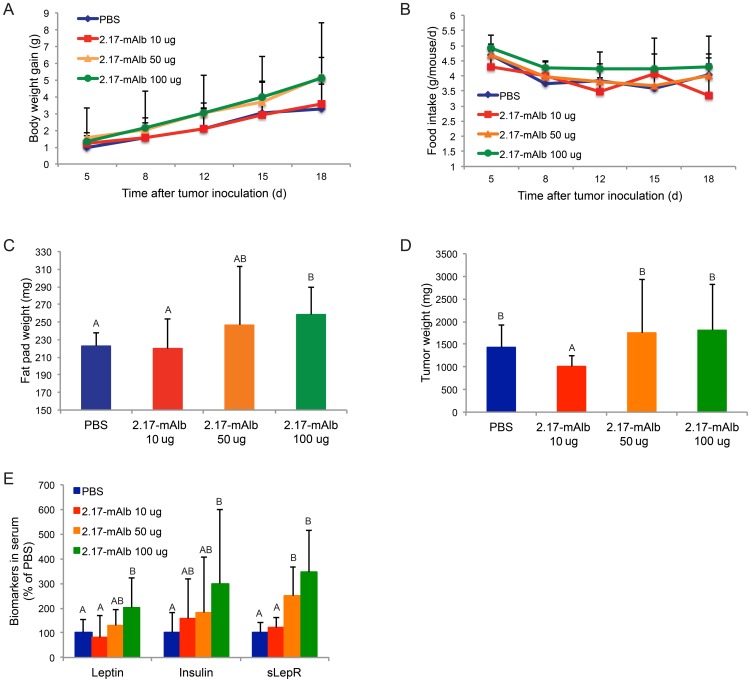
Figure 7. Subcutaneous administration of 2.17-mAlb in the established tumor model when treatment was delayed till palpable tumors appeared.
(A) Weight gain (n = 9 per group, P<0.05 2.17-mAlb 100 µg compared to PBS and 2.17-mAlb 10 µg. No significance between other groups). (B) Food intake (n = 9 per group, P<0.05 2.17-mAlb 100 µg compared to PBS and 2.17-mAlb 10 µg. No significance between other groups). (C) Epididymal fat pad weight (n = 9 per group, bars not connected by same letter are significantly different). (D) Tumor weight (n = 9 per group, bars not connected by same letter are significantly different). (E) Biomarkers in serum (n = 9 per group, bars not connected by same letter are significantly different). Data are means±SD.

