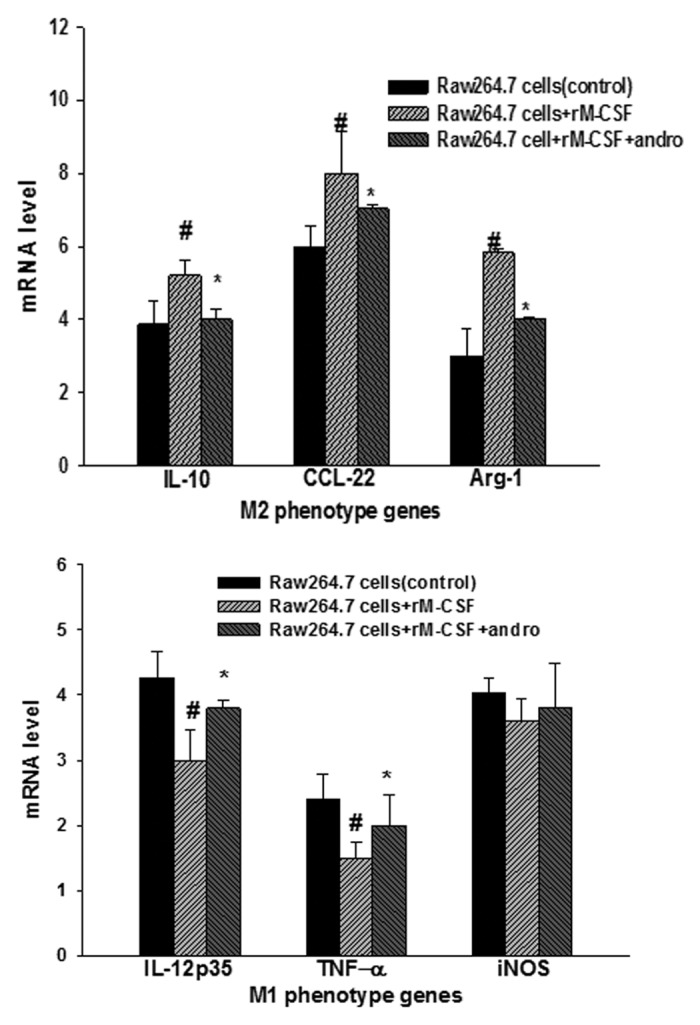
Figure 5. Phenotype identification of surface markers (M1 phenotype genes [IL-12p35, TNF-α, and iNOS] and M2 phenotype genes [IL-10, CCL22, and Arg1]) was determined by real-time PCR. Blocking NFκB by adding Andro affected M-CSF-mediated M2 polarization state including polarized cytokine production. RAW 267.4 macrophages untreated, stimulated with M-CSF for 24 h, or stimulated with andro for another 12 h after 24 h of M-CSF treatment and were subsequently analyzed. Results are representative of 10 separate experiments. Statistical differences between groups was calculated by one way ANOVA. #P < 0.05 vs. RAW 264.7, *P < 0.05 vs. RAW 264.7+rM-CSF.
