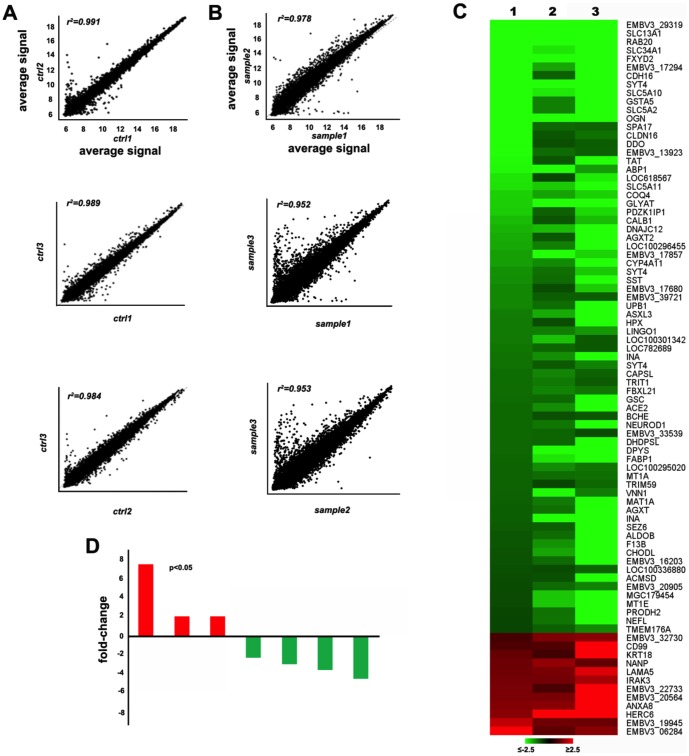
Figure 1. Microarray hybridization experiments.
Panel A and panel B show the correlation of the results among the three samples of each group (respectively ctrl = normal embryos and sample = retarded embryos); Panel C depicts the heat map corresponding to some differential expressed transcripts. The number 1, 2, 3 refer to retarded embryo samples; Panel D shows the relative fold change of some differential expressed transcripts.

