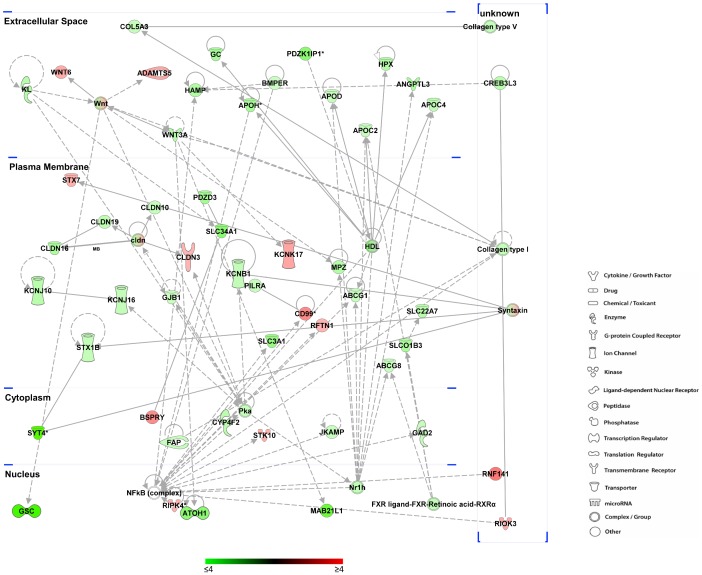
Figure 4. Lipid metabolism network.
The scheme shows the altered transcripts involved in lipid metabolism pathways (according to IPA algorithm). The putative cellular and extracellular localization of each transcript is also shown. The colour of each transcript indicates the expression status: the colour scale from green to red indicates the degree of down- and up-regulation respectively. The legend of shapes correspondence is also reported.

