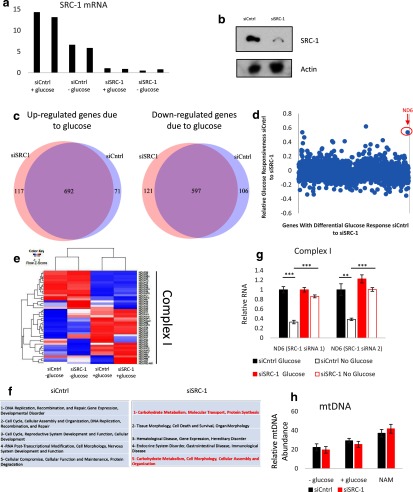
Figure 4.
Microarray analysis and validation of SRC-1's role in reacting to glucose deprivation in A549 cells. Fourteen hours after glucose deprivation, (a) RNA was harvested for qPCR quantification of SRC-1 mRNA levels and (b) whole-cell lysates were then subjected to immunoblot analysis for the indicated proteins. c, Microarray analysis of glucose-responsive genes in response to nontargeting siRNA (siCntrl) or siSRC-1. A549 cells with siCntrl or siSRC-1 were grown in the absence or presence of glucose, RNA was harvested for microarray analysis 14 hours after glucose deprivation. d, Comparison of differential glucose-responsive genes from the microarray analysis with siCntrl or siSRC-1. Values used for the scatter plot were generated by the following equation: value = (RNA levels of siCntrl with glucose − RNA levels of siCntrl without glucose) − (RNA levels siSRC-1 with glucose − RNA levels siSRC-1 without glucose) / (RNA levels siCntrl with glucose − RNA levels siCntrl without glucose). e, Comparison of mitochondrial electron transport chain complex I genes from the microarray analysis. f, Ingenuity Pathway Analysis under glucose deprivation of nontargeting siRNA and siSRC-1. g, A549 cells with siCntrl or siSRC-1 were grown in the absence or presence of glucose. RNA was harvested for qPCR quantification of ND6 mRNA expression 14 hours after glucose deprivation. h, A549 cells were grown under high-glucose DMEM, with or without 10 mM NAM or no-glucose DMEM for 24 hours. DNA was harvested and mtDNA was quantified. *, P < .05; **, P < .01; and ***, P < .005.

