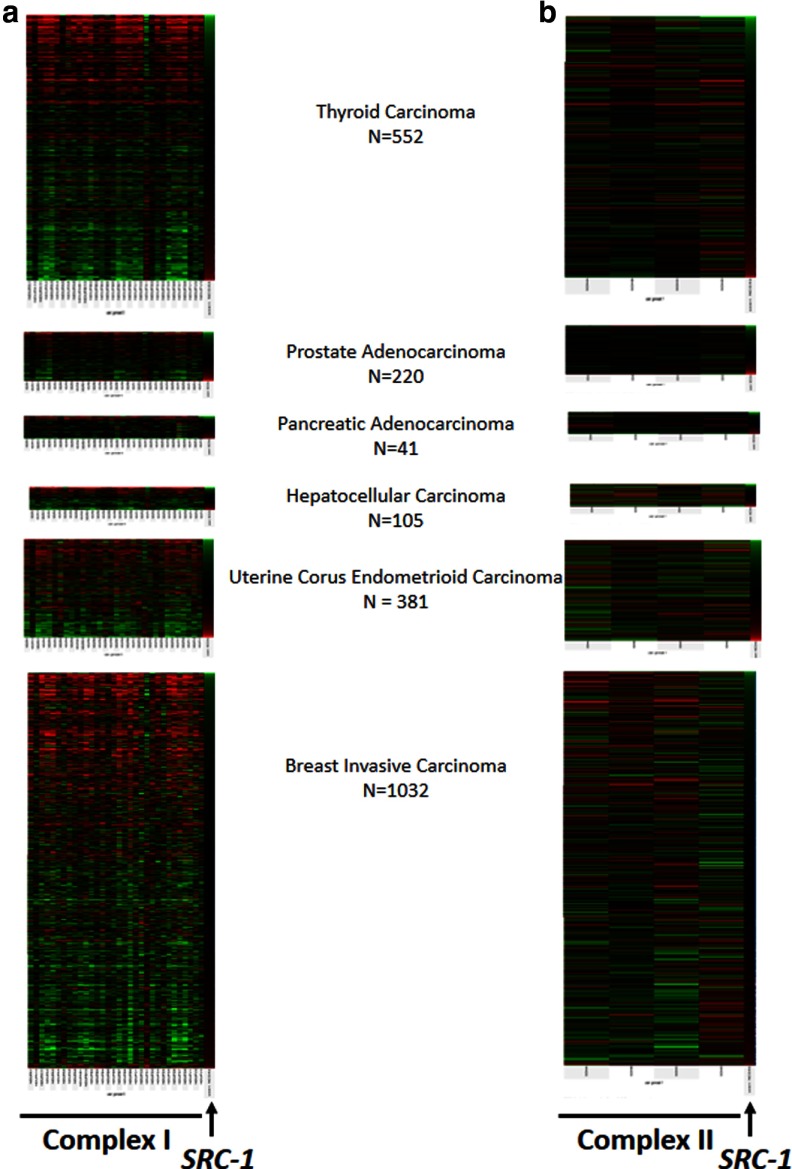
Figure 6.
SRC-1 expression levels are strongly correlated to complex I subunit mRNAs but not complex II subunits mRNAs. a, The mRNA expression profile of SRC-1 and complex I in a number of cancer types. Samples were clustered from low to high SRC-1 levels (top to bottom). b, The mRNA expression profile of SRC-1 and complex II in a number of cancer types. Samples were clustered from low to high SRC-1 levels (top to bottom). Green represents low expression, and red represents high expression.

