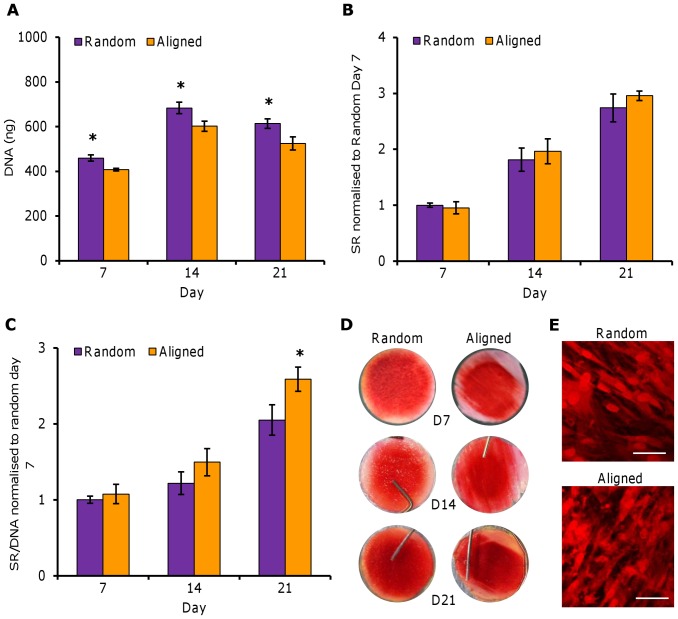
Figure 3. Total DNA and SR staining of HDFs on PCL fibres.
HDFs seeded on random and aligned electrospun PCL fibres were assayed for total DNA by Pico Green and collagen deposition by SR staining. Total DNA (A) and total SR stain (B) was quantified at days 7, 14 and 21. SR was normalised to total DNA (C) at each time point. SR staining can be visualised (D). Data is mean ± SD (n = 6–9), *p<0.05.

