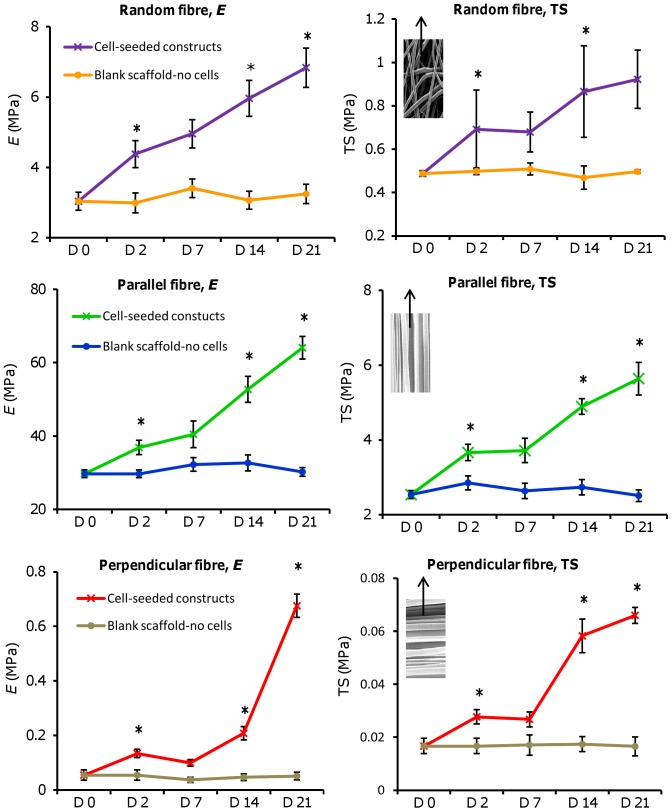
Figure 9. Tensile testing performed on blank and HDF-seeded constructs of different fibre orientations.
Scaffold properties were observed at day 0 (blank-no cells) and days 2, 7, 14, and 21 (with cells). Notice the difference in the y-axis scale for each scaffold orientation (parallel > random > perpendicular). SEM images indicate scaffold orientation with arrow showing direction of tensile force applied. Data is mean ± SD (n = 6: random and parallel or n = 3: perpendicular), *p<0.05 verses previous time point tested.

