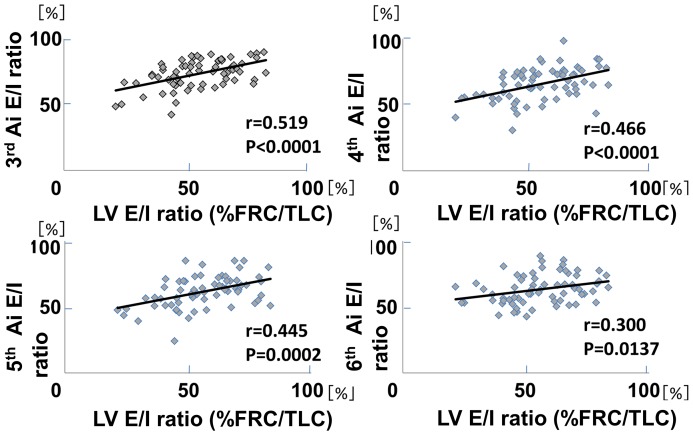
Figure 6. Comparisons of Ai E/I ratio with LV E/I ratio(%FRC/TLC) from the 3rd to the 6th generation.
There were significant positive correlations between the ratio of Ai and that of LV at any generation. X-axis indicates % FRC/TLC expressed as LV E/I ratio, and Y-axis indicates Ai E/I ratio. Each dot represents the data of individual subject and thus the relation between two variables indicates the relationship, not in an individual, but among the subjects, whose % FRC/TLC was so variable, dependent on COPD stages.

