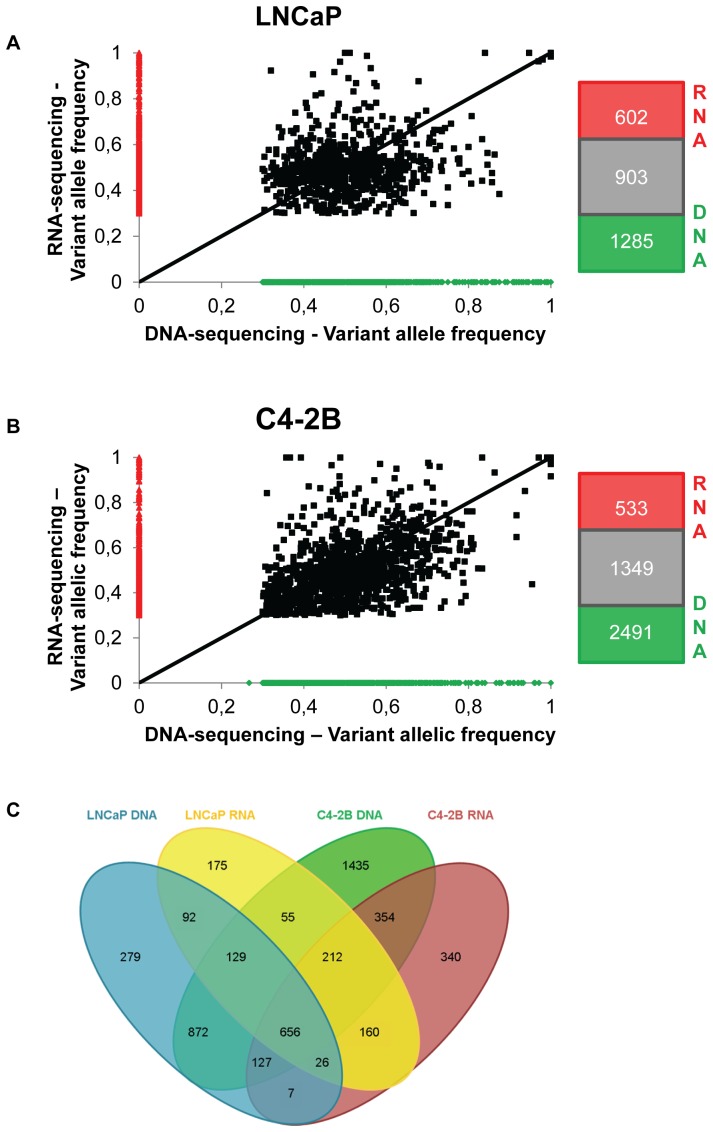
Figure 1. Comparison of variant allelic frequencies measured by whole exome and transcriptome sequencing.
A–B. Comparison of the variant allelic frequency of mutations detected using whole exome and transcriptome sequencing. Black dots are mutations that have been found by both exome sequencing and transcriptome sequencing; red dots were only detected by exome sequencing and green dots only by RNA sequencing. For variant calling, a cut-off of 30% variant allelic frequency was applied. Next to the graph a figure shows the number of mutations from exome sequencing, transcriptome sequencing and the number found by both methods. Graphs are shown for LNCaP (A) and C4-2B cells (B) respectively. C. Overlap of all mutations observed by exome and transcriptome sequencing in LNCaP and C4-2B cells.

