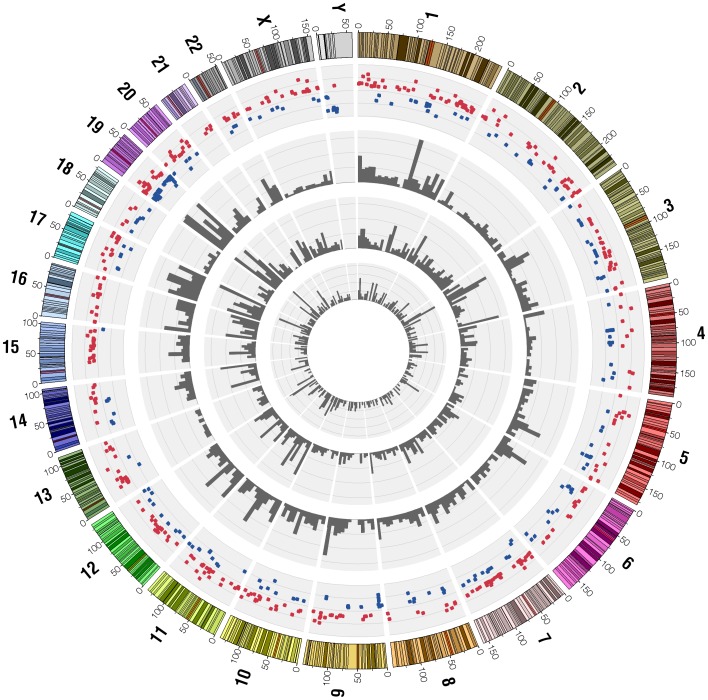
Figure 4. Representation of the catalog of differentially expressed genes and mutations in LNCaP and C4-2B cells.
Chromosome ideograms are shown around the outer ring and oriented pter-qter in a clockwise direction with centromeres indicated in red. The outer ring represents differentially expressed genes: 457 genes with higher expression in C4-2B (red dots) and 246 genes with higher expression in LNCaP (blue dots). Other tracks contain (from outside to inside): 2244 mutations in common between LNCaP and C4-2B cells, 2129 mutations specific for C4-2B cells and 546 mutations specific for LNCaP cells shown by density per 10 megabases.

