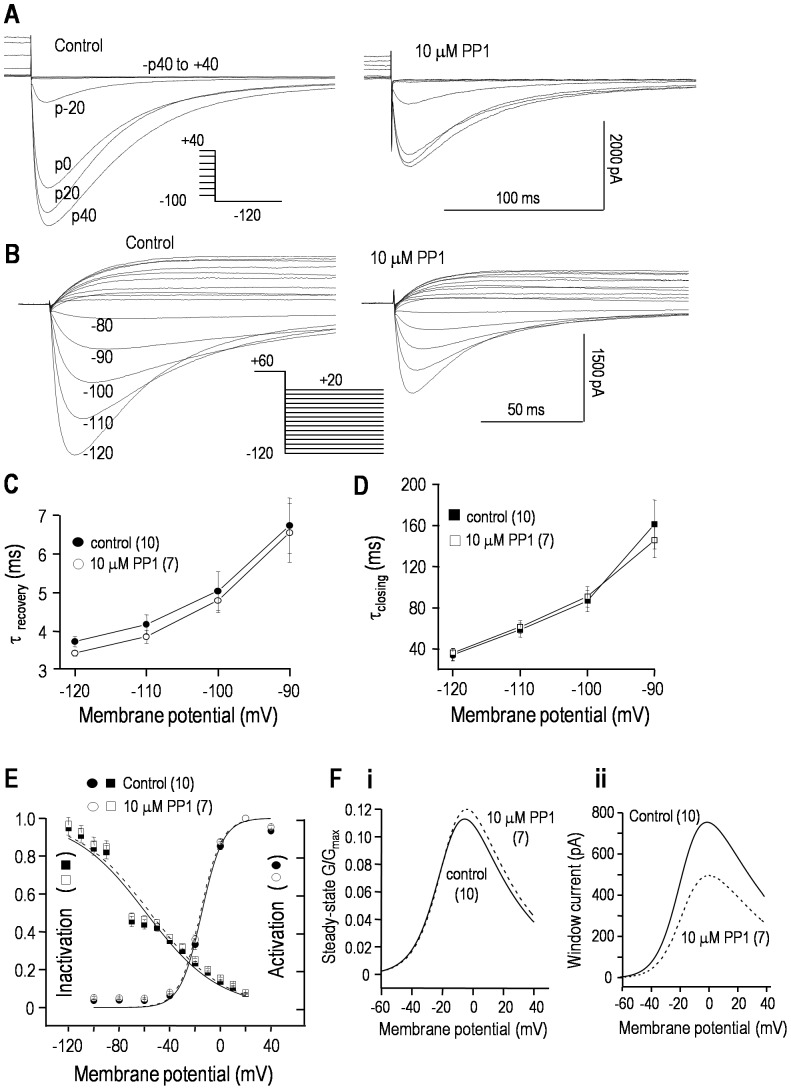
Figure 2. PP1 reduces the hERG window current without apparently affecting the voltage dependence or kinetics.
Whole-cell hERG currents in stably transfected HEK293 cells, with representative current traces in response to the voltage-clamp protocols shown as insets. For all panels, control recordings at 25 min are compared with 25 min after adding 10 µM PP1 to the bath. A. The voltage dependence of activation was monitored by varying the 6 s long pre-pulse between −100 and +40 mV (20 mV increments) (c→o→i). Then, the maximal inward current was measured during a test pulse to −120 mV, which rapidly relieved inactivation (i→o) and revealed transient hERG currents before the channels slowly closed (o→c). The peak amplitudes were used to construct activation-vs-voltage curves (summarized in panel E). B. A single protocol was used to monitor the voltage dependence of inactivation, and the time courses of recovery from inactivation and channel closing. From a holding potential of −80 mV, a 1 s-long pre-pulse to +60 mV activated and then inactivated the channels (c→o→i). Then, test pulses were applied between −120 and +20 mV (10 mV increments). The rapid increase in inward currents reflects recovery from inactivation (i→o; summarized in C), and the subsequent slow decline reflects closing (o→c; summarized in D). The maximal current at each test voltage was used to construct inactivation-vs-voltage curves (summarized in panel E). C, D. Time constants (τ) of recovery from inactivation (C) and closing (D) are summarized. For test potentials between −120 and −90 mV, the currents (as in panel B) were fitted to a dual exponential (rising and falling) function: It = Io+(AMPr*exp(−t/τr)+AMPd*exp(−t/τd)). The values are presented as mean±SEM for the number of cells in parentheses. E. Activation-vs-voltage curves were obtained by fitting the peak currents (examples in panel A) to a Boltzmann equation: G/Gmax = 1/(1+exp[(Vm−V1/2)/k]), where Vm is membrane potential, V1/2 is the potential at which G/Gmax = 0.5, and k is the slope factor. The degree of inactivation as a function of voltage (data as in panel B) was calculated from: I/(G slope(Vm−E K)), where I is the peak current at each voltage, Vm is the test potential, E K is the K+ Nernst potential, and G slope is the maximal slope conductance, calculated from a linear fit to the I–V relation between −120 and −90 mV (not shown). F. The window current was calculated by multiplying the results of each fitted equation (panel E) by the maximal whole-cell conductance and dividing by the driving force (Vm−EK).

