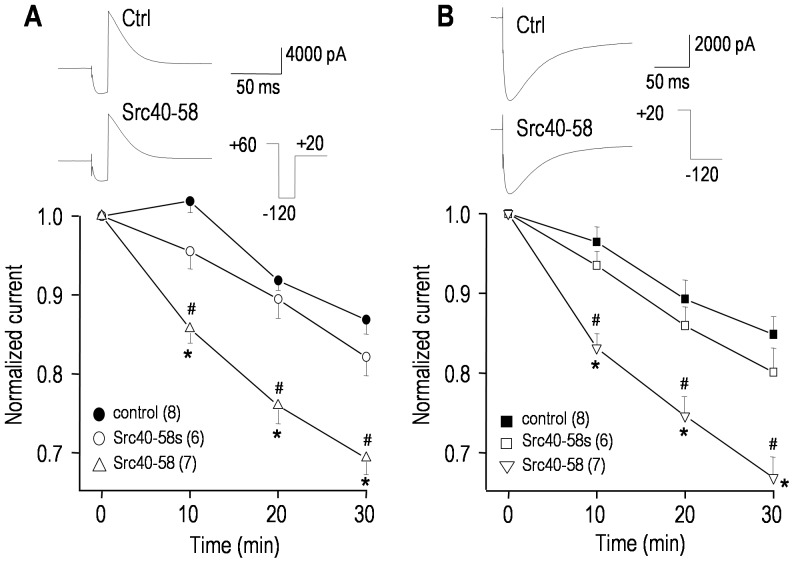
Figure 3. Src tyrosine kinase regulates the hERG current.
Currents were compared between cells recorded with pipette solutions containing saline (to control for spontaneous changes), 100 µg/mL of a Src-inhibitory peptide (Src40-58), or 100 µg/mL of a scrambled version of the same peptide (Src40-58s). For each cell, the voltage protocol was repeated at 0, 10, 20 and 30 min of recording; and the representative current traces (upper panels) are from 2 control cells and 2 treated cells, all at 30 min. A. The voltage protocol was similar to Fig. 1B; i.e., from a holding potential of −80 mV, a 1 s long pulse to +60 mV was applied to activate the channels. Then inactivation was removed by a 16 ms long pulse to −120 mV, and the maximal outward tail current was measured during a test pulse to +20 mV. The lower panel summarizes the time course, measured from the maximal tail current, normalized to its initial value at 3–4 min after establishing a recording. B. Following a 6 s long pre-pulse to +20 mV to activate the channels, the maximal inward tail current was measured during the test pulse to −120 mV (similar protocol to Fig. 2A). The summarized time course in the lower panel was constructed as in panel A. Significant differences for Src40-58 are shown compared with controls (*p<0.05) or the scrambled peptide (# p<0.05).

