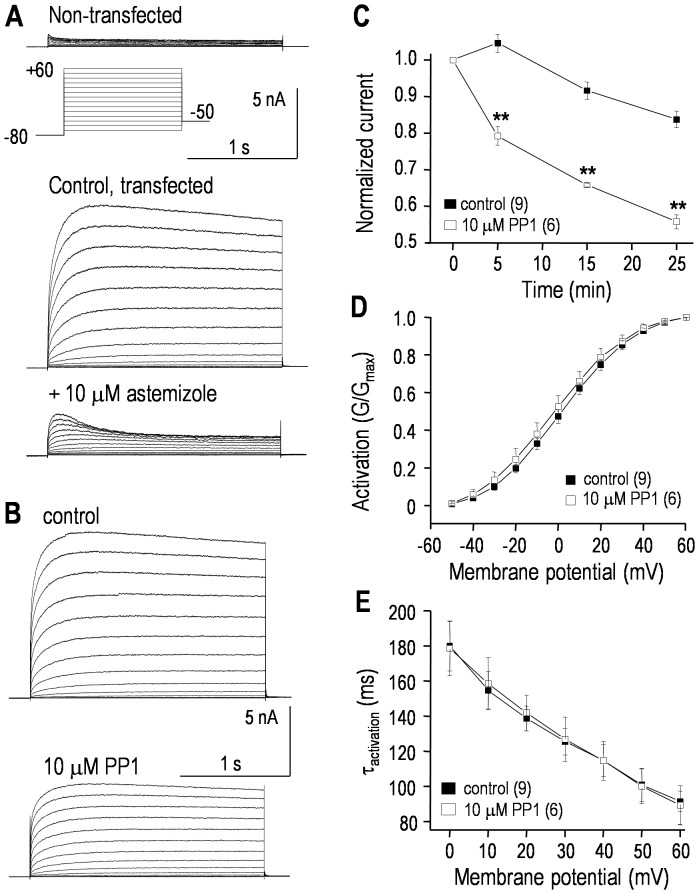
Figure 4. The hEAG1/Kv10.1/KCNH1 current is regulated by a Src-family kinase.
Whole-cell recordings of hEAG1 currents in transiently transfected HEK293 cells. The same voltage-clamp protocol (inset) was used for all recordings; i.e., from a holding potential of −80 mV, 1 s-long voltage steps were applied between −70 and +60 mV (in 10-mV increments). A. Typical recordings from a non-transfected HEK293 cell, and a hEAG1-transfected cell before and 5 min after adding the EAG blocker, astemizole. Note that the currents are plotted on the same scale. B. Representative hEAG1 currents from a transfected cell recorded 3–4 min after establishing a whole cell recording; and 25 min after bath addition of the Src-family kinase inhibitor, PP1. C. Summary of time-dependent inhibition of hEAG1 currents by PP1. The voltage protocol was applied every 5 min, and the peak current measured at +60 mV was normalized to its initial value. Significant differences are indicated: **p<0.01. D. To obtain activation -vs-voltage curves, the peak current during each voltage step was divided by the driving force (Vm–EK) to calculate conductance, and then normalized to the largest conductance (i.e., at +60 mV). Each conductance-vs-voltage curve at 25 min was fitted to a Boltzmann equation: G/Gmax = 1/(1+exp[(Vm−V1/2)/k]), where Vm is membrane potential, V1/2 is the potential at which G/Gmax = 0.5, and k is the slope factor. The summarized curves are for control cells and separate PP1-treated cells. E. Time constants (τ) for hEAG1 current activation were measured for each test pulse by fitting a mono-exponential function: It = AMP*exp(−t/τ), as in Fig. 1E.

