
Figure 1. Hepatic expression of CES1 lowers hepatic triglyceride levels and improves glucose homeostasis.
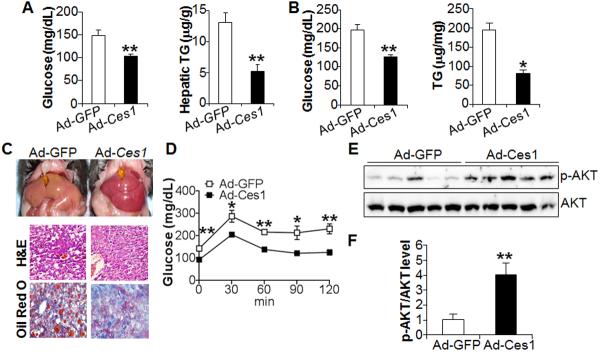
(A) C57BL/6 mice were i.v. injected with either Ad-GFP or Ad-Ces1 (n=7–8 mice per group). After 7 days, mice were fasted for 5 h. Plasma glucose (left panel) and hepatic TG (right panel) levels were determined. (B–F) ob/ob mice were i.v. injected with Ad-GFP or Ad-Ces1 (n=5 mice per group). After 7 days and a 5-h fast, mice were euthanized. Plasma glucose (B, left panel) and hepatic TG levels (B, right panel) were determined. Representative liver images are shown in (C, top panel) and representative H&E staining (C, middle panel) or oil red O staining (C, bottom panel) of the liver sections are shown in (C). Glucose tolerance test (GTT) was performed after a 16 h fast (D). Western blot assays were performed using liver lystates (E) and protein levels quantified using ImageJ software (F).