
Figure 3. Hepatic expression of CES1 increases triglyceride hydrolase activity and activates PPARα.
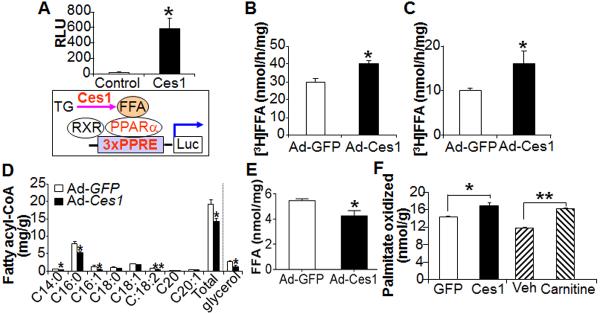
(A) HepG2 cells were transfected with a control plasmid or a Ces1-expressing plasmid together with a 3xPPRE-Luc reporter plasmid. Luciferase activity was determined (top panel). In the bottom panel, the diagram shows that CES1 hydrolyzes TG and releases FFAs, which bind to PPARα/RXR complex and then induce PPARα activity. (B, C) TGH activity was assessed using lysates from COS-7 cells (B) or the liver (C). (D, E) Hepatic fatty acid profile was determined by GC-mass spectrometry (D) and hepatic FFA levels were quantified (n=8 mice per group) (E). (F) FAO was performed in the liver cell line AML12 cells that were infected with Ad-GFP or Ad-CES1 for 48 h, or treated with either vehicle or carnitine (1 mM) (n=3–5 per group). Carnitine treatment serves as a positive control. Veh, vehicle.