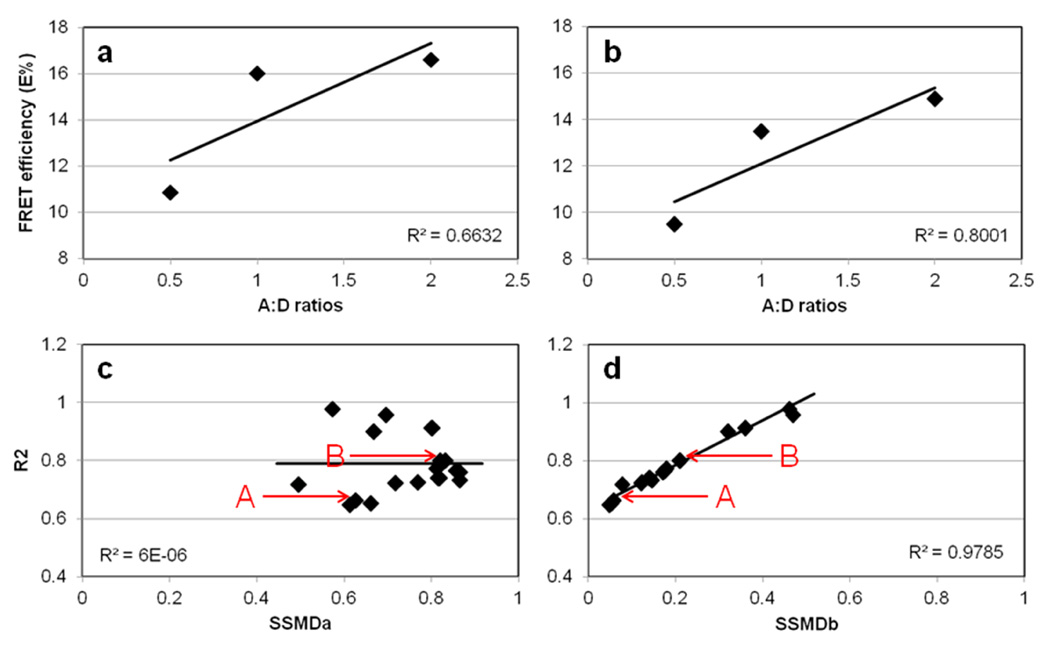
Figure 3. Validation of FRET ROI selection protocol using SSMD as a SNR related statistical parameter.
E% is calculated and plotted against A:D~1:2, A:D~1:1, and A:D~2:1 of TFR-Tfn complexes internalized into HMECs for 60min at 37°C. Despite lower FRET signal in HMECs, a trend for higher E% relative to increasing A:D ratios is clearly seen. The following ROI selection settings were used in panel a: ED=5 and %F=0 (Table 1, #11); and in panel b: ED=5 and %F=30 (Table 1, #15). The R2 of the E% vs. A:D relationship is increased when using %F=0 to %F=30, from R2=0.6632 to 0.8001, respectively. In panel c, the R2 values calculated for the E% vs. A:D relationship using different ROI selection settings (Table 1) were plotted against the SSMDa between A:D~2 vs. A:D~0.5. In panel d, the R2 values calculated for the E% vs. A:D relationship using different ROI selection settings (Table 1) were plotted against the SSMDb between A:D~2 vs. A:D~1. Whereas, R2 vs. SSMDa show an independent behavior, R2 vs. SSMDb shows a clear direct relationship with high R2=0.978. A and B (arrows) represent the values calculated using the settings used in panel a & b respectively (Table 1; #11 vs. #15). As shown in panel a & b and in Table 1, E% values show significant variance upon using different ROI datasets; SSMD analysis as shown in panel c & d and Table 1, is used to establish the best ROI dataset that shows the widest dynamic range of the E% signal. Thus, SSMD provides a FRET data quality assessment that combines signal range and variability measures in a concise summary number.

