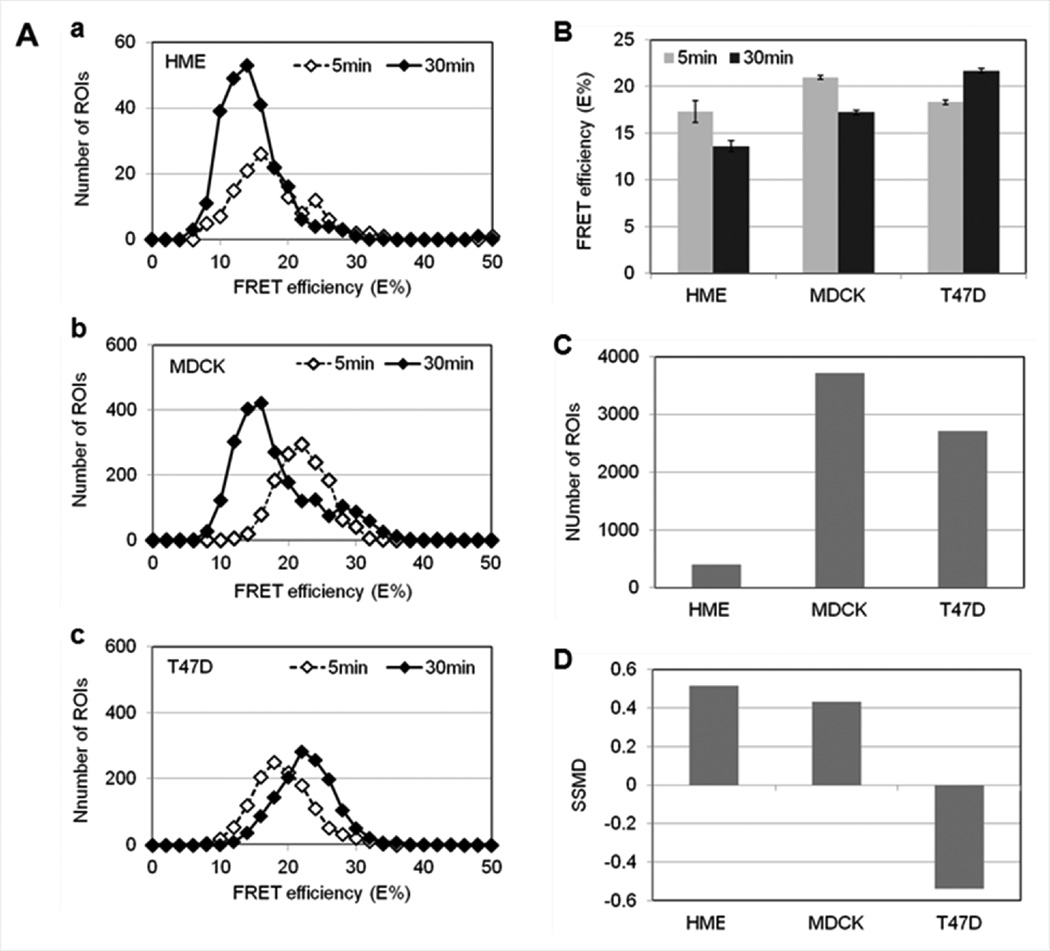
Figure 9. Changes in E% levels detected during endoctic trafficking of TFR-Tfn complexes in HMEC, MDCK-PTR and T47D cells.
(A) Histogram analysis of E% distribution at 5min (white diamonds) vs. 30min (black diamonds) internalization of TFR-Tfn complexes into HME (Panel a), MDCK-PTR (Panel b) and T47D (Panel c) cells. (B) E% averages at 5min (gray) vs. 30min (black) internalization of TFR-Tfn complexes into HME, MDCK-PTR and T47D cells. Error bars indicate 95% confidence interval. (C) Number of ROIs selected for HME, MDCK-PTR and T47D cells. (D) SSMD analysis. Although the number of ROIs decreases dramatically in HME cells due to their reduced level of TFR expression, SSMD values remain >0.4 for both MDCK and HME datasets. In contrast, T47D cells show negative SSMD values indicating a reversed E% behavior during TFR-Tfn endocytic trafficking.

