
Figure 7. Measured noise power spectral density.
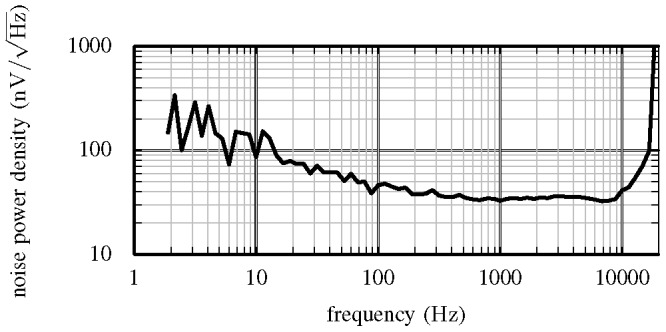
This figure shows the measured noise power spectral density with the programmable band-pass filter programmed with the wide pass-band.
Official websites use .gov
A
.gov website belongs to an official
government organization in the United States.
Secure .gov websites use HTTPS
A lock (
) or https:// means you've safely
connected to the .gov website. Share sensitive
information only on official, secure websites.
This figure shows the measured noise power spectral density with the programmable band-pass filter programmed with the wide pass-band.