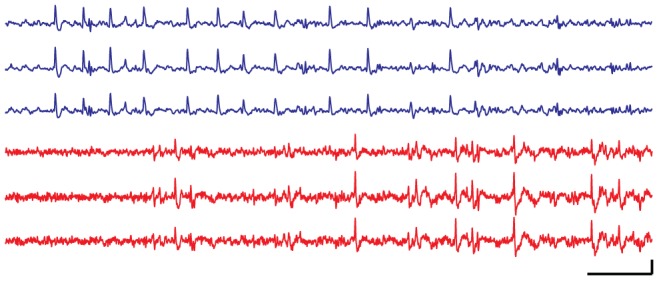
Figure 11. Sample neural waveforms from the RoSco and Axona system.

100(top three traces, blue) and Axona (bottom three traces, red). The RoSco signal has been digitally filtered with a high-order high-pass filter at 300 Hz. The increased detail of the Axona signal is due to the difference in sample rate: RoSco at 20 kHz and Axona at 48 kHz. Scale bars at bottom right are 10 ms and 50 µV for x-axis and y-axis respectively.
