
Figure 12. Comparison of characteristic unit spikes from the RoSco and Axona systems.
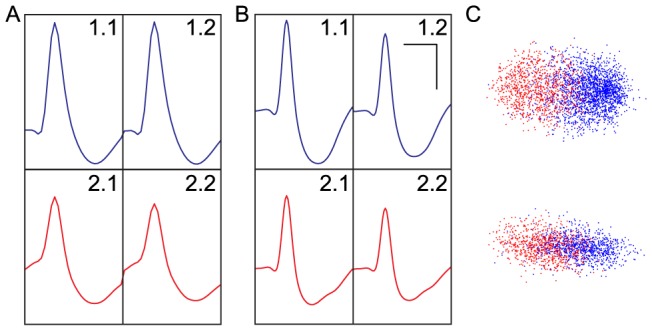
(a, b) Waveforms were isolated from two units (blue – unit 1; red – unit 2) using (a) RoSco (RMS SNR range 2.0–3.1) and (b) Axona (RMS SNR range 1.8–2.8). Scale bars at top right are 500 µs and 50 µV for x-axis and y-axis respectively. (c) Example dimensions from the unit clustering, for the two units in a and b, obtained using the WaveClus package for the RoSco (top) and Axona (bottom) data. Both dimensions are unitless feature space.