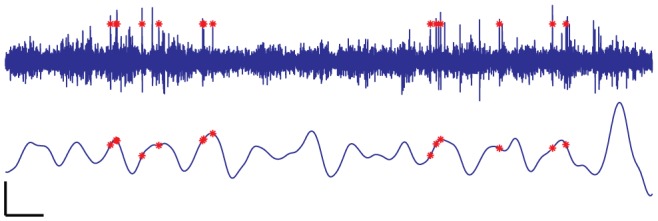
Figure 13. Electrical recording and identified spike times from two units.

One unit from the dentate gyrus is shown with red stars in: (a) the raw trace and (b) a theta-filtered 4-12 Hz LFP. Unit activity appears more often on particular phases of the theta cycle, as expected from many earlier hippocampal studies [19], [20]. Scale bars at bottom left are 100 ms for x-axis and 50 µV/250 µV for top/bottom y-axes.
