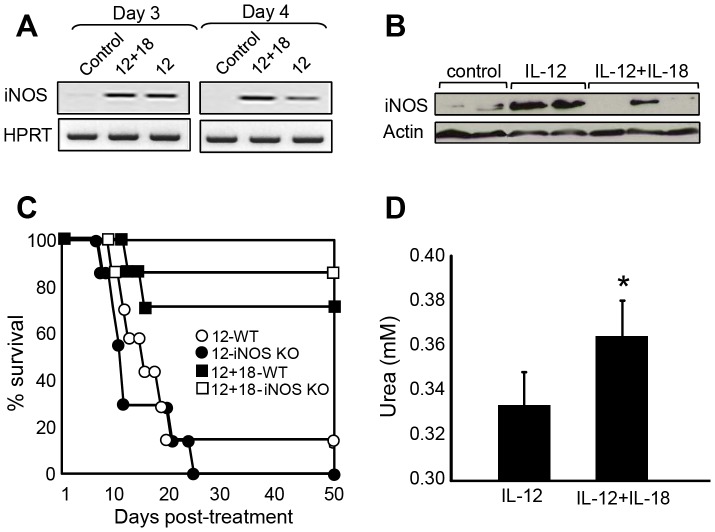
Figure 2. inflammatory profile of Mφ following IL-12 cDNA treatment.
(A) RT-PCR analysis of iNOS gene expression in splenocytes obtained from mice injected with the designated cDNAs, 12+18 and 12 vs control p<0.05. (B) Western blot analysis of splenocyte protein extracts obtained from mice injected with the designated cDNAs, 12 vs 12+18, p<0.05. (C) Survival monitored in B6 (WT) or iNOS KO mice in the days post-IL-12 or IL-12+IL-18-cDNA injection. (D) Arginase activity measured determination of urea levels in 1×10⁶ splenocytes. The data in A, B and D are expressed as the mean of 2 different experiments with 4–5 mice per group. Survival curve was built as a pool of 2 different experiments with 5 mice per group. *12+18 vs 12 p<0.05.

