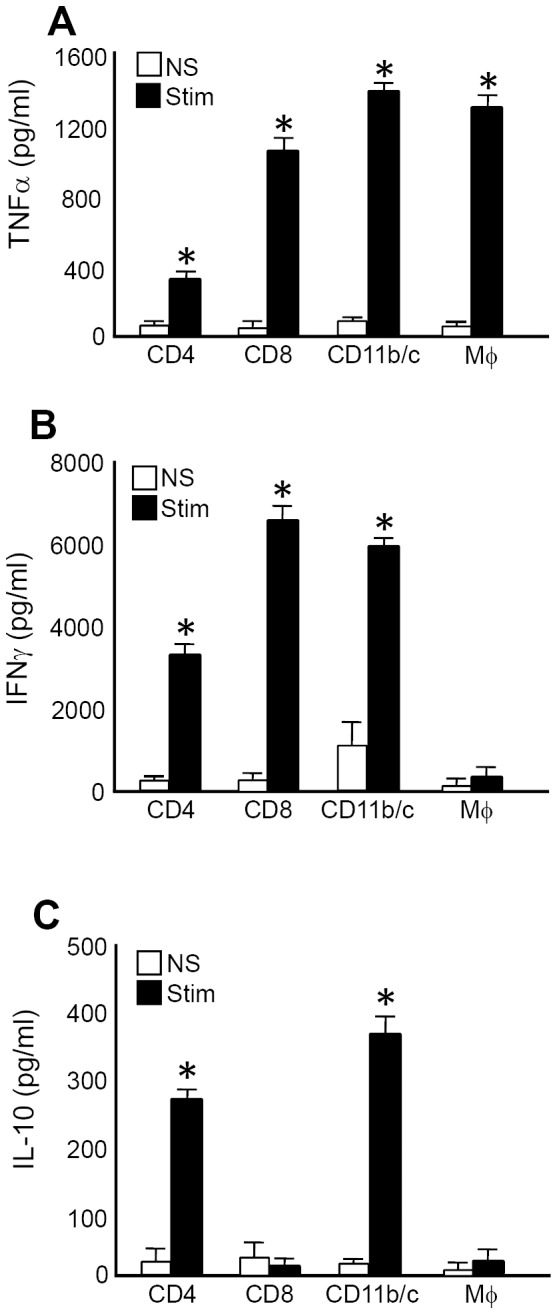
Figure 3. Splenocytes produce Th1 and Th2 cytokines after IL-12+IL-18 cDNA treatment.

Splenocytes from IL-12+IL-18 mice were obtained and stained with anti-CD4, anti-CD8 and anti-CD11b/c fluorocrome labeled Abs and then sorted to a purity of 97–99% using a MoFlo sorter (Dako Cytomation). Sorted cells were then cultured in the presence of anti-CD3 coated Ab (2 µg/ml) and LPS (1 µg/ml) for 72 h. Supernatants were then harvested and (A) TNFα, (B) IFNγ and (C) IL-10 expression were evaluated by ELISA. Data are expressed as the mean of 2 different experiments with 4-5 mice per group. *Stimulated vs non-stimulated, p<0.001.
