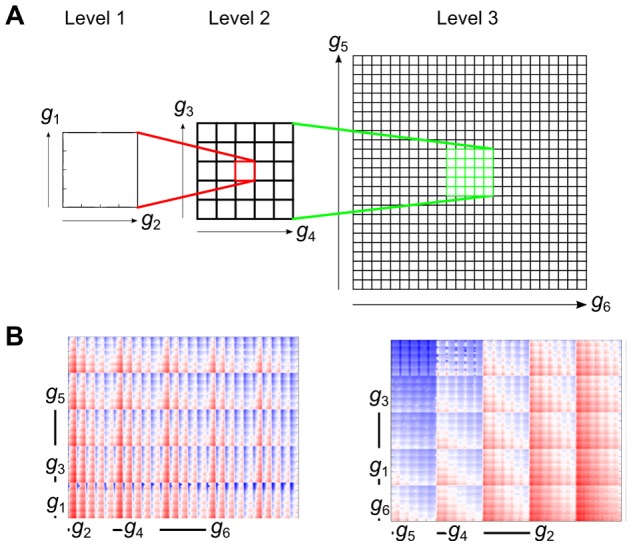
Figure 1. The dimensional stacking process.

(A) The effect of two ‘low order’ conductances (g 1 and g 2) are plotted in a contour plot, with all other conductances held constant at their control value. This plot is then embedded in a larger grid spanning two ‘medium order’ conductances (g 3 and g 4). For each value of g 3,4, the g 1,2 plot is repeated for the respective values. This process is repeated to represent the two ‘high order’ conductances (g 5 and g 6). (B) Example showing a random stack order (left), versus an optimised stack order (right) for the same variable.
