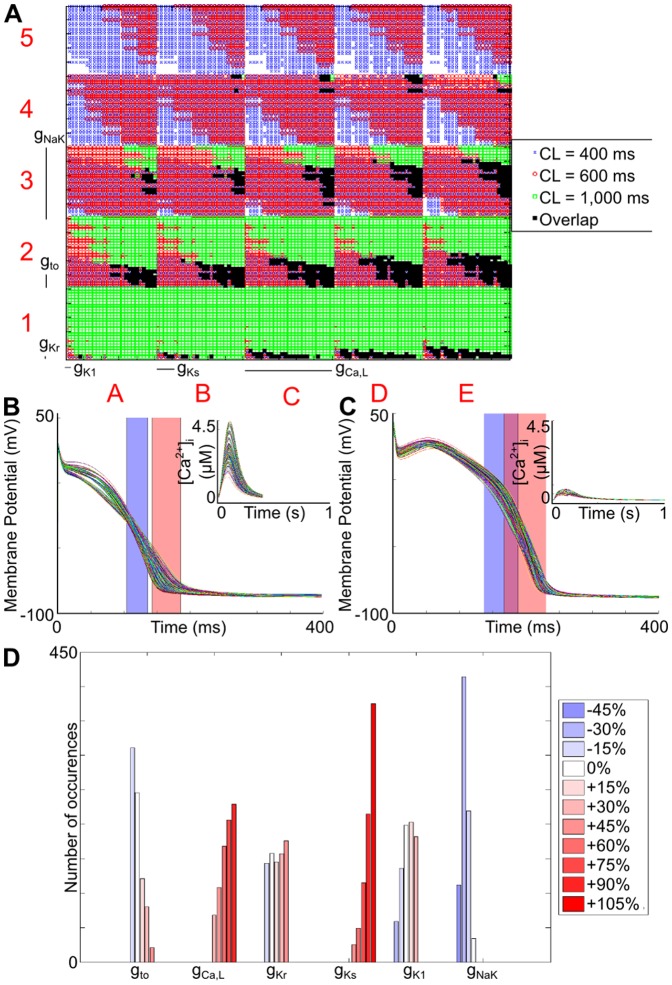
Figure 3. Parameter sets for the expanded Mahajan search that produce values of both APD50 and APD90 that fall within the experimentally derived range.
(A) Dimensional stack image showing the location of matching parameter sets for each CL and their overlap. (B) Vm and [Ca2+]i (inset) profiles for the matching parameter sets at a CL of 400 ms. (C) Vm and [Ca2+]i (inset) profiles for the matching parameter sets at a CL of 1,000 ms. (D) Distribution of conductance values for the valid parameter sets. For both (B) and (C), the physiological ranges of APD50 and APD90 are represented by the blue and red rectangles, respectively.

