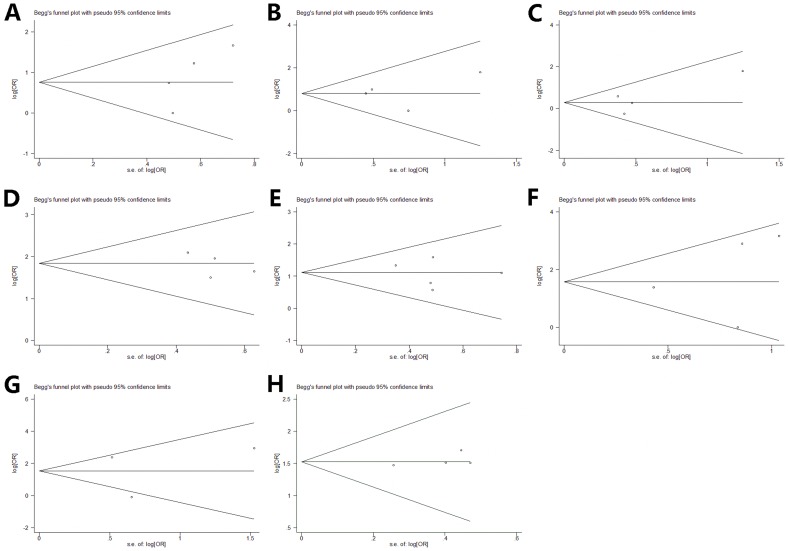
Figure 3. Begg's Funnel plot for publication bias test.
The two oblique lines indicate the pseudo 95% confidence limits. a. funnel plot with pseudo 95% CI of preeclampsia b. funnel plot with pseudo 95% CI of ventouse delivery c. funnel plot with pseudo 95% CI of oxytocin induction d. funnel plot with pseudo 95% CI of heart rate abnormalities e. funnel plot with pseudo 95% CI of meconium-stained liquor f. funnel plot with pseudo 95% CI of Apgar scores g. funnel plot with pseudo 95% CI of arterial umbilical cord ph h. funnel plot with pseudo 95% CI of resuscitation at birth.

