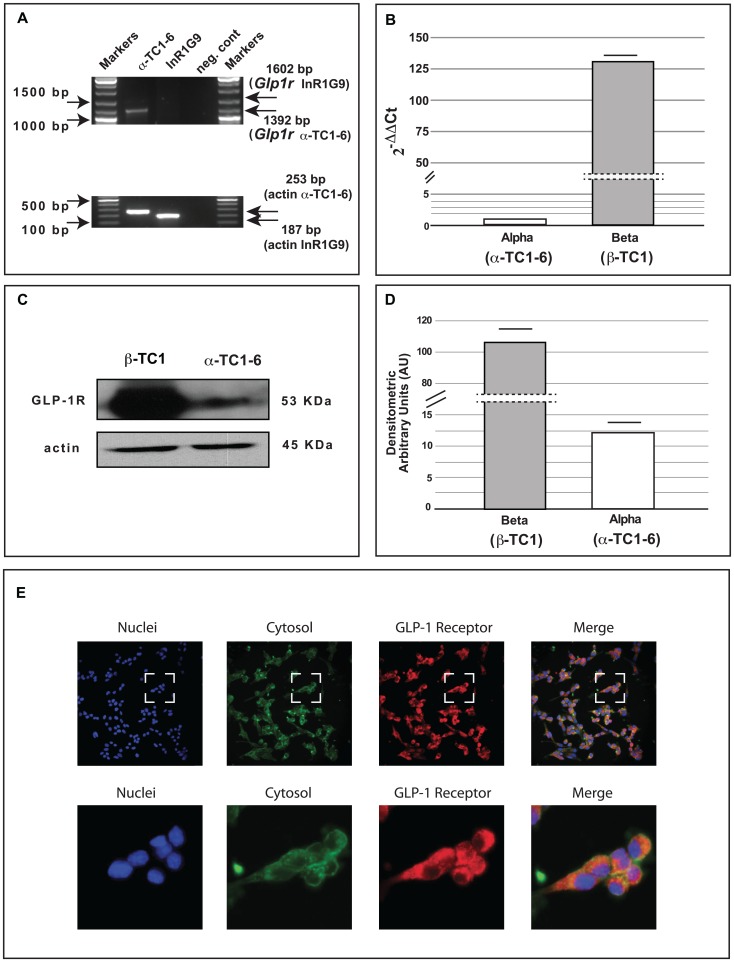
Figure 1. GLP-1 receptor expression in alpha cells ( TC1-6 and InR1G9) and in beta cells (
 TC1).
TC1).
(A) Full length Glp1r transcript expression as analysed by RT-PCR in α-TC1-6 and in InR1G9 cells. (B) Glp1r gene expression as analysed by Real Time PCR (means of five experiments) in beta cells (β-TC1 cells as positive control) and alpha cells ( TC1-6); data are expressed as (2−ΔΔCt) considering as 1 the Glp1r gene expression in alpha cells (
 TC1-6) and using mouse actin beta (Actb) as housekeeping gene. (C) Representative Western Blot of GLP-1R protein expression in β-TC1 cells and in
  TC1-6 cells. (D) Densitometric analysis of GLP-1R protein expression in β-TC1 cells and in
  TC1-6 cells. The data are the means of five different experiments ± SE. (E) GLP-1R (red) immunoreactivity in
  TC1-6 cells. Hoechst 33258 was used to visualize nuclei (blue) and phalloidin to stain the cytoskeloton (green). Squares (upper side) indicate the areas shown at higher magnification (lower side).

