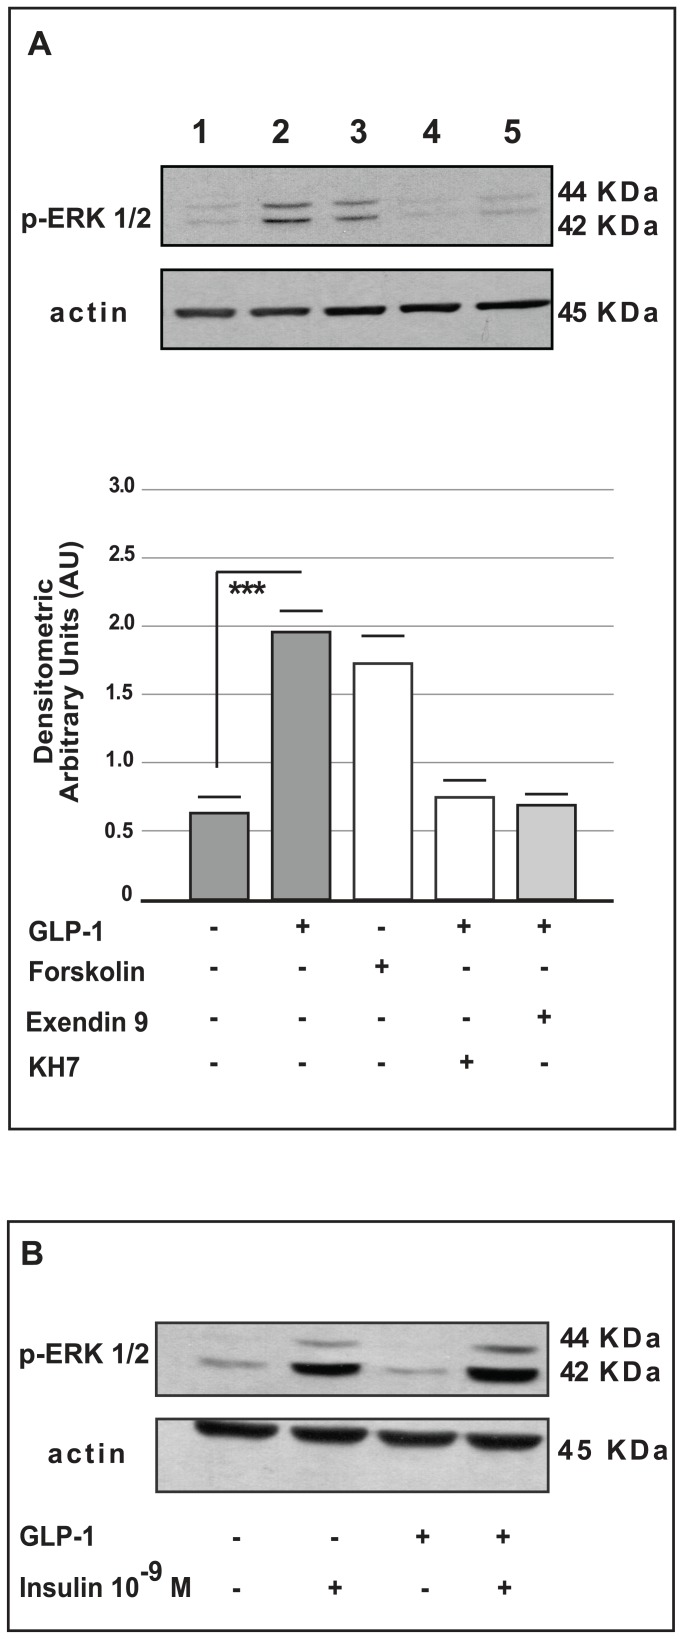
Figure 4. Western blot analysis for Erk 44/42MAPK phosphorylation in alpha cells ( TC1-6 and InR1G9).
The upper side of panel (A) shows a representative Western blot for Phospho-p44/42 MAPK (Erk1/2) (Thr202/Tyr204) and for actin in  TC1-6 cells: control cells (line 1), in cells cultured in the presence of GLP-1 (100 nmol/l) for 72 hours (line 2), in cells treated with adenylyl cyclase activator (Forskolin 50 nmol/l) for 72 hours (line 3), in cells treated with GLP-1 (100 nmol/l) and an adenylyl cyclase inhibitor (KH7 25 µmol/l) for 72 hours (line 4) and in cells cultured for 72 hours in the co-presence of GLP-1 (100 nmol/l) and Exendin-9 (100 nmol/l) (line 5). The lower side shows the densitometric analysis from five different experiments. The data are expressed as the means ± SE. *** p<0.001 vs. control groups, using one-way ANOVA followed by Bonferroni test. (B) Western blot analysis for Phospho-p44/42 MAPK (Erk1/2) (Thr202/Tyr204) and actin in InR1G9 cells cultured in the presence or absence of GLP-1 (100 nmol/l) for 72 hours, washed and acutely stimulated with insulin (10−9 M) for the last five minutes in the presence or absence of GLP-1 (100 nmol/l).

