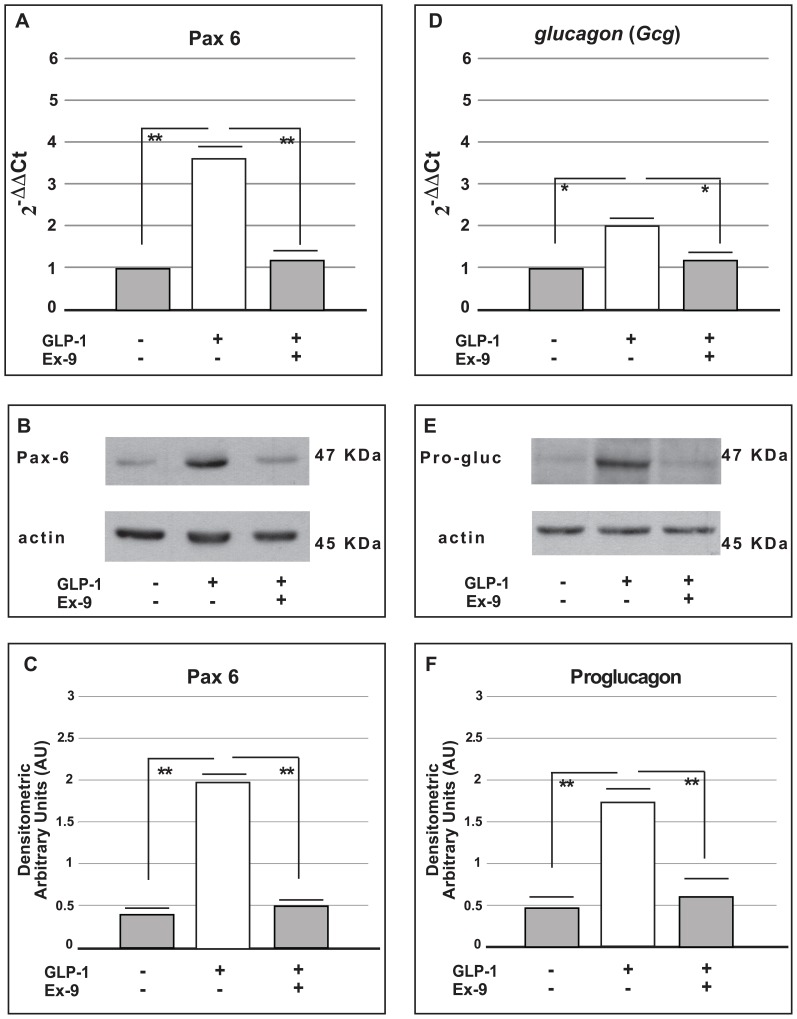
Figure 5. Real-time PCR analysis and Western blot analysis for Pax6 and glucagon (Gcg) gene and protein expression in alpha cells ( TC1-6).
Panel (A) shows the expression of Pax 6 as determined by Real-Time PCR analysis (means from five different experiments) in control cells and in cells cultured for 72 hours in the presence of GLP-1 (100 nmol/l) alone or in combination with Exendin-9 (100 nmol/l). Panel (B) shows a representative Western Blot for the Pax6 protein expression in control cells and in cells cultured for 72 hours in the presence of GLP-1 (100 nmol/l) alone or in combination with Exendin-9 (100 nmol/l); Panel (C) shows the densitometric analysis (means from five different Western Blot experiments). The data are expressed as means ± SE. ** p<0.01, using one-way ANOVA followed by Bonferroni test. Panel (D) shows the expression of the glucagon (Gcg) gene as determined by Real-Time PCR analysis (means from five different experiments) in control cells and in cells cultured for 72 hours in the presence of GLP-1 (100 nmol/l) alone or in combination with Exendin-9 (100 nmol/l). Panel (E) shows a representative Western Blot for proglucagon protein expression in control cells and in cells cultured for 72 hours in the presence of GLP-1 (100 nmol/l) alone or in combination with Exendin-9 (100 nmol/l). Panel (F) shows the densitometric analysis (means from five different Western Blot experiments). The data are expressed as the means ± SE. * p<0.05; ** p<0.01, using one-way ANOVA followed by Bonferroni test.

