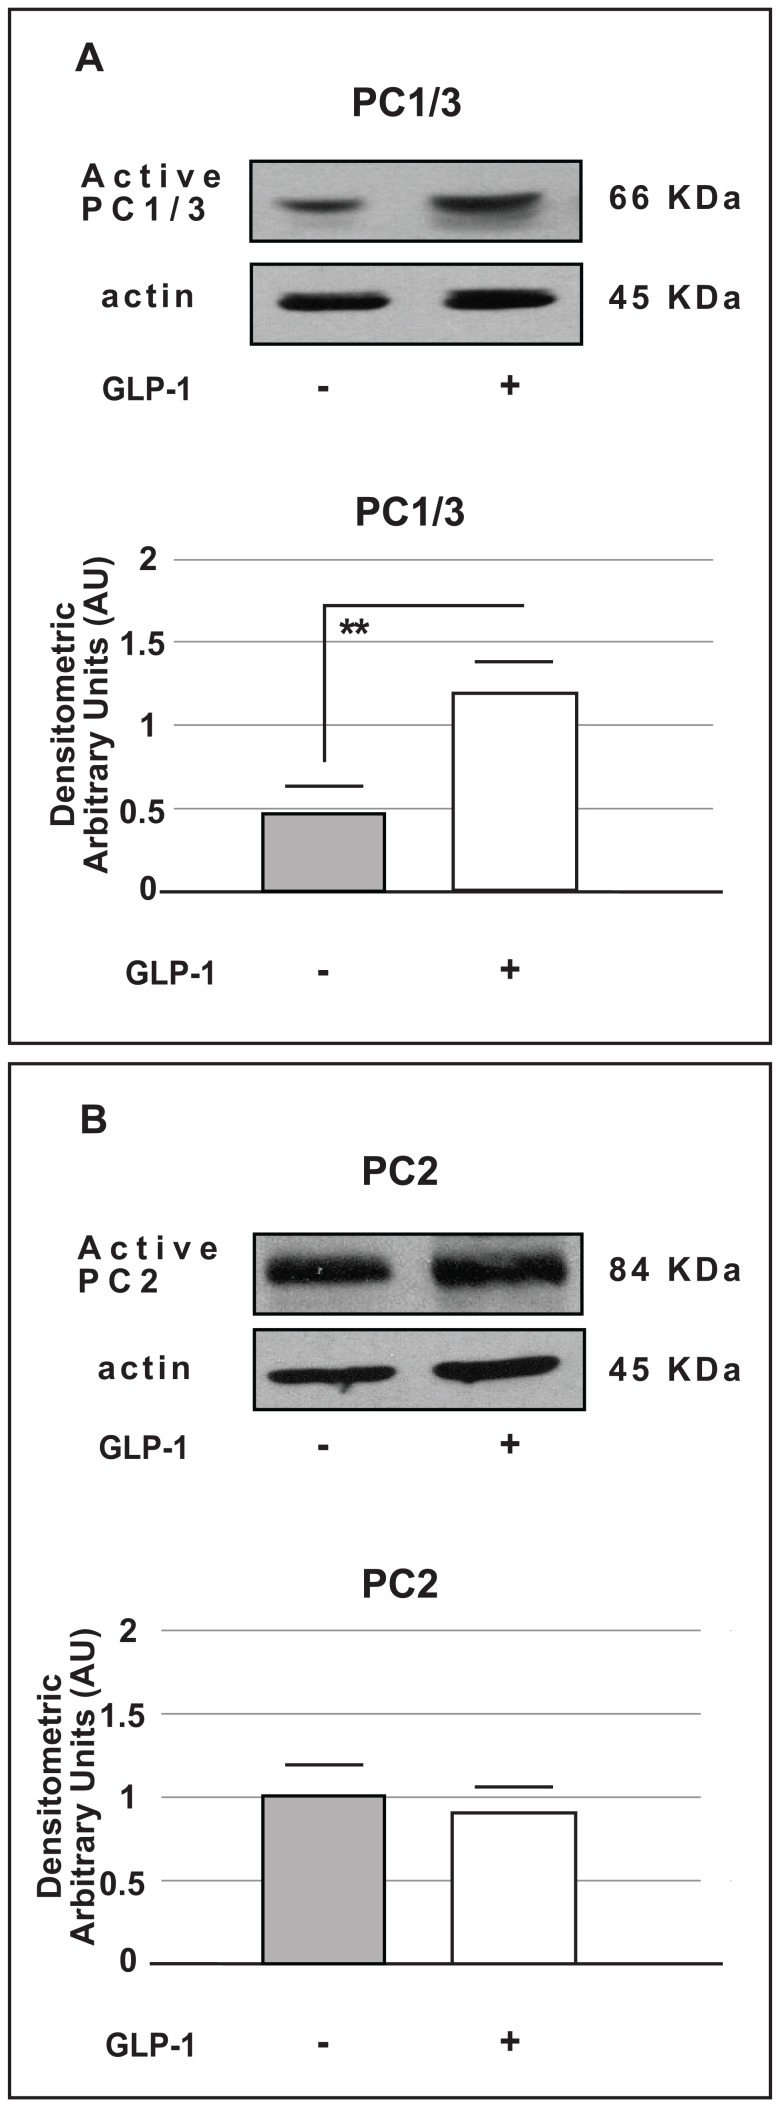
Figure 7. Western blot analysis for PC1/3 and PC2 protein expression in alpha cells ( TC1-6).
Western blot analysis of active PC1/3 (A) and PC2 (B) protein expression in control cells and in cells cultured for 72 hours in the presence of GLP-1 (100 nmol/l). The upper sides of the panels show representative Western Blots for active PC1/3 or active PC2. The lower sides of the panels show the densitometric analysis (means from five different Western Blot experiments). The data are expressed as the means ± SE. ** p<0.01 vs. control group.

