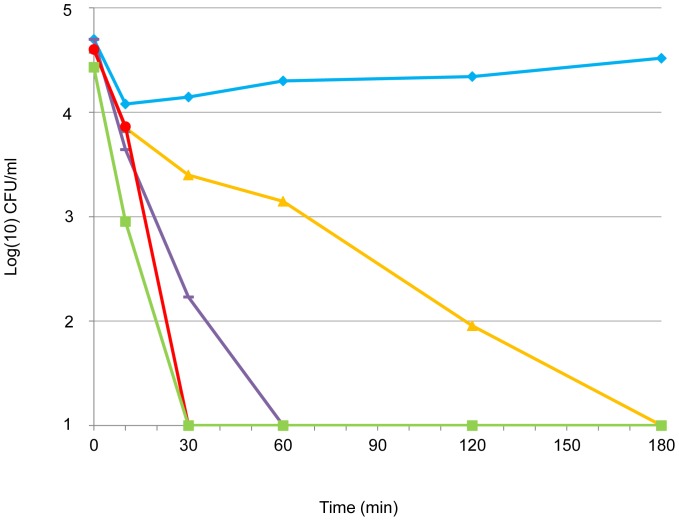
Figure 1. Time-kill kinetics of different NaCl concentrations against P. aeruginosa isolate Pa71.
3% NaCl solution (orange line, filled triangles), 5% NaCl solution - corresponding to the MBC value (violet line, dash), 7% NaCl solution (red line, filled circles), and 10% NaCl solution (green line, filled squares). Control (blue line, filled lozenges) was not exposed to NaCl. Time-kill curves of 15% (not shown) and 10% NaCl solution were similar.

