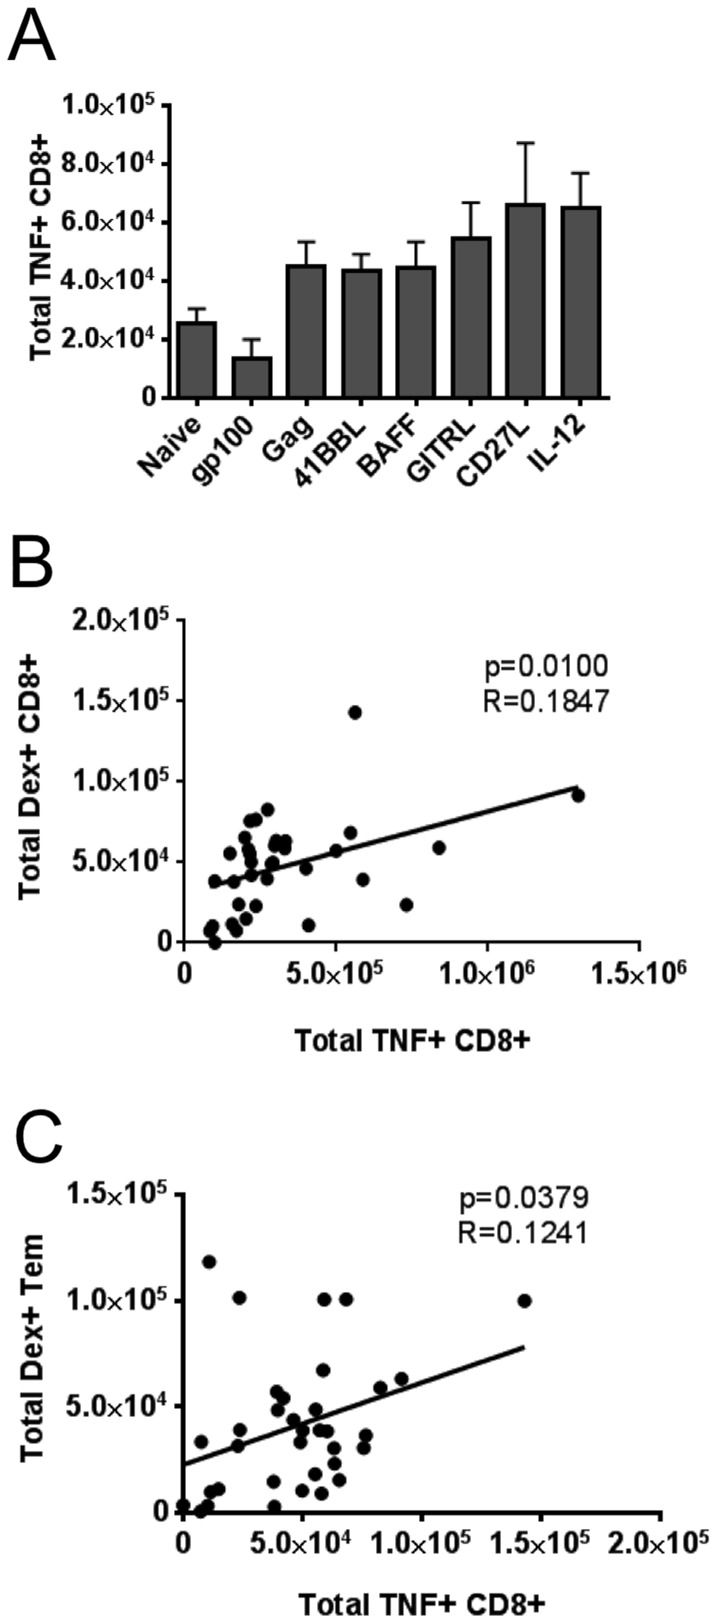
Figure 8. Intracellular cytokine staining and correlation between immune responses.
Panel A: Total number of TNF-producing CD8+ T cells. 2×10⁶ splenocytes were stimulated with HIV-1 Gag peptide AMQMLKETI (5 ug/ml) for 6 hours in the presence of 1 ul/ml GolgiPlug to promote retention of TNF inside cells. Cells were washed twice then surface stained with anti-mouse CD3, CD4, and CD8α for 30 minutes before being fixed and permeabilized. Cells were then intracellularly stained with anti-mouse TNF-α antibody. After wash and fixation, cells were run immediately on an LSR-Fortessa flow cytometer (BD Biosciences). Absolute numbers of TNF+ CD8+ T cells were determined per spleen. Panel B: The number of cells expressing TNF after stimulation with Gag peptide was significantly correlated with the overall number of Gag-specific, dexamer-positive CD8+ T cells. Panel C: The number of cells expressing TNF after stimulation with Gag peptide was significantly correlated with the number of Gag-specific, dexamer-positive T effector memory (Tem) CD8+ T cells defined as cells that were CD3+ CD8+ CD127+ CD62L-. Statistical values for correlation were calculated using GraphPad Prism 6 software.

