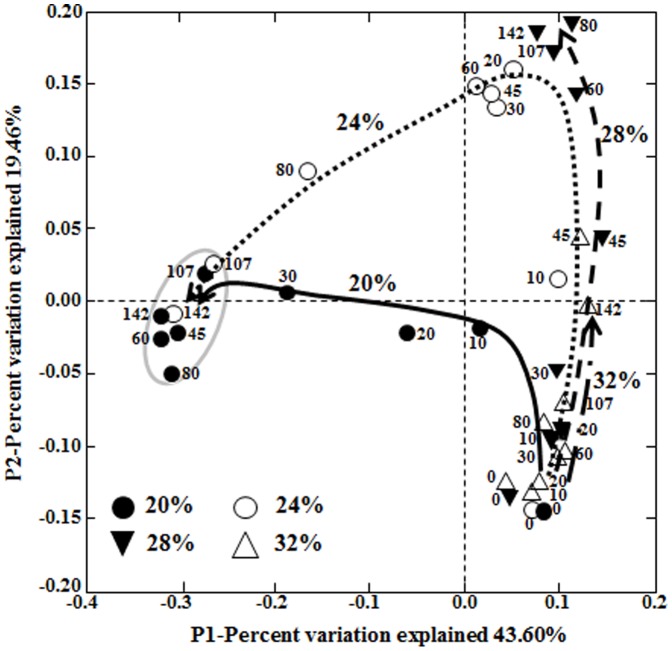
Figure 4. The weighted principle coordinate analysis (PCoA) plot showing the bacterial successions in saeu-jeot samples with 20%, 24%, 28%, and 32% salt concentrations during saeu-jeot fermentation.
Numbers beside the symbols represent the fermentation time (days). The curved arrows indicate the routes of the bacterial successions on the PCoA plot during saeu-jeot fermentation. Saeu-jeot samples inside the circle included Halanaerobium as the predominant genus.

