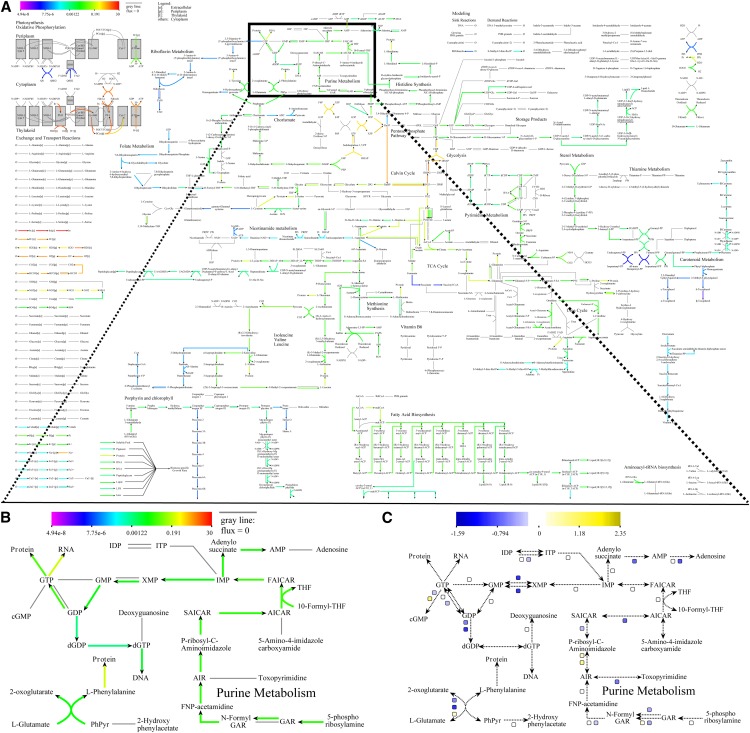
Figure 1.
An overview of the graphical map of the metabolism of Synechocystis and its capabilities. Various elements (reactions, metabolites, and squares) are clickable and direct the user to the KEGG database or to run result details. A, When displaying FBA results, the arrows denoting reactions are colored according to the color scale in the top left corner. Gray reactions carry no flux. B, Detailed view of a section of the map when it is used to display FBA results. C, Detailed view of the same section of the map as in B, but now it is being used to display gene expression results. Here, the reaction lines are only displayed to indicate the general structure of the metabolic map, whereas the gene expression information is conveyed by colored boxes next to each reaction for which gene association information is available.

