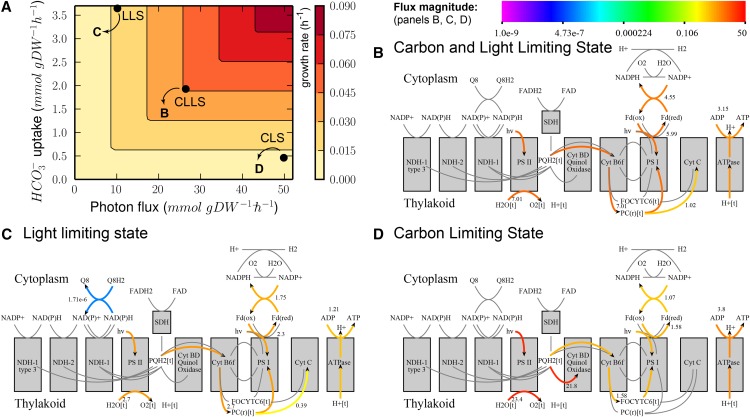
Figure 3.
We used FBA to explore the properties of the Synechocystis model and map under various conditions, i.e. CLLS, LLS, and CLS. A, Predicted growth rate as a function of carbon and light uptake rates. The black dots in the phase plane indicate the conditions (in terms of photon flux and HCO3– uptake) that are shown in panels B to D. B to D, Visualization of predicted FBA fluxes for the three scenarios (CLLS, LLS, and CLS). Arrows indicate flux direction; the color bar indicates flux magnitude.

